
Building Network Analysis Applications with Streamlit and st-link-analysis - Python Tutorial
Learn to create interactive network analysis applications using Streamlit and st-link-analysis, featuring customizable visualizations, real-time interaction, and efficient data handling capabilities.

Creating Your AI/BI Genie Space for Business Data Analytics
Discover how to empower business teams with AI/BI Genie - a conversational interface that enables natural language data exploration and self-service analytics for instant insights.

Building Professional Diagrams in Microsoft Visio 365 - A Beginner's Tutorial
Master the fundamentals of creating professional diagrams in Visio 365, from basic shape manipulation to connecting elements and applying custom styles for clear, visually effective business documentation.
Database Operations from the Disk's Perspective
Dive into advanced database performance optimization through real-time IO visualization, NVMe SSD operations, and monitoring metrics for maximizing throughput in data-intensive applications.
Using Maltego Monitor for Real-Time Event Analysis - The 2024 Olympics Case Study
Discover real-time monitoring techniques for public safety during major events using Maltego Monitor's AI-powered sentiment analysis and threat detection capabilities.
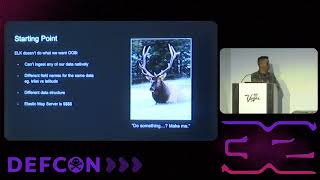
MoWireless MoProblems: Modular Wireless Survey System and Data Analytics with PacketGlass
Discover how to build and implement a modular wireless survey system using PacketGlass for efficient collection, visualization, and analysis of massive wireless network data through Elastic-based analytics.
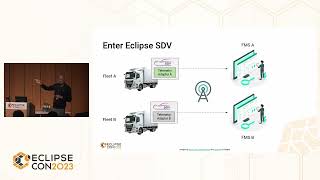
Trucks on a Leash - Fleet Management the Open Source Way
Discover how open-source technology revolutionizes truck fleet management, reducing costs through standardized data collection, cloud integration, and vendor-independent solutions for real-time vehicle monitoring.
한 눈에 전국 방방곡곡 사람들의 움직임 파악하기 - 지오비전퍼즐 데이터 분석 서비스
Discover how SKT's GeoVision Puzzle leverages telecom big data analytics to provide precise population movement insights and API solutions for businesses across South Korea.
How to Make Field Engineers Use Data Daily - A Case Study of Infrastructure Bot
Discover how SK Telecom transformed data accessibility, enabling 300+ team members to leverage daily infrastructure reports through an innovative messenger-based bot system for enhanced operational efficiency.
The Challenges of Product Analytics - Building Reliable Data Infrastructure and Metrics
Discover practical strategies for implementing reliable product analytics, from selecting actionable metrics to building scalable infrastructure while avoiding common pitfalls in data-driven decision making.

Gamification in Oil and Gas Industry Training Through Virtual Reality
Discover how virtual reality transforms oil industry training through an innovative gaming approach, making complex geological concepts accessible while enhancing collaborative exploration and data analysis.
Why a Good Data Scientist is a Package of Professions - Beyond Technical Skills
Discover how data scientists can evolve beyond technical roles by mastering storytelling, communication, and cross-functional skills to effectively collaborate with product managers and drive business impact.
Business Intelligence Toolkit Powered by Natural Language Processing
Discover how NLP methods power a BI toolkit for arts and culture, featuring keyword extraction, text classification, and impact analysis through geo-referenced visualization for social value creation measurement.

Visual Design - Creating Clean and Aesthetic Data Visualizations
Master the art of creating clean, aesthetic data visualizations through proven best practices and BI tool features to transform complex data into compelling stories that drive innovative business decisions.

The Art and Science of Infographic Design - Balancing Creativity and Data Analysis
Master the balance between creativity and data accuracy in infographic design through real-world examples, exploring effective decision-making techniques for compelling data visualization and analytics.
Data Storytelling in the Era of Generative AI - Using LLMs for Interactive Consumer Research
Explore how LLMs revolutionize consumer research by transforming static data into interactive, evidence-based synthetic personas that provide dynamic, real-time insights for marketers.

From Novice to Catalyst - Scaling Security Tools with Metrics
Discover how to implement and scale security metrics effectively, from data extraction to visualization, while learning to leverage the Multivac framework for enhanced threat management and risk reduction.

Building an IoT Monitoring App with InfluxDB
Aprenda a construir um aplicativo de monitoramento IoT usando InfluxDB e Flask, explorando replicação edge-to-cloud e técnicas avançadas de gerenciamento de dados em tempo real.

Leveraging Apache Flight Python Client and InfluxDB for Time Series Data Management
Explore Apache Flight Python Client and InfluxDB integration for efficient time series data management. Learn about columnar storage, benchmarks, and real-world applications in data architecture.
Advanced Visualization Techniques for Complex Data Sets
Explore advanced visualization techniques for complex datasets, focusing on interactive methods and best practices for large-scale data representation in SRE contexts.
Discovering Wolfram Food through AI
Explore AI-powered food data analysis using Wolfram's tools, from nutrition retrieval to recipe transformation and chatbot integration.