Working with SPSS
Learn to use SPSS for data analysis: from data entry and import to advanced statistical techniques like ANOVA, regression, and correlation. Master creating charts and formatting outputs.
Data Visualization Using Python in Seaborn
Learn to create statistical graphics in Python using Seaborn. Master line plots, bar plots, scatterplots, histograms, joint plots, and box plots for effective data visualization and analysis.
Statistics O Level
Comprehensive guide to O Level Statistics, covering mean, mode, median, range, scatterplots, and correlation. Ideal for exam preparation and mastering key statistical concepts.
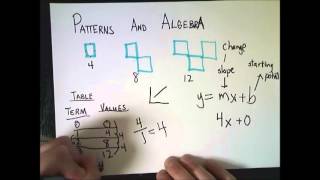
Algebra 2 Class Topics
Comprehensive review of Algebra 2 concepts, covering sequences, functions, graphing, inequalities, and matrices. Ideal for students seeking to strengthen their algebraic skills.

Matplotlib Tutorial
Comprehensive tutorial on Matplotlib, covering various plot types, customization options, and integration with Pandas. Ideal for data visualization in Python.
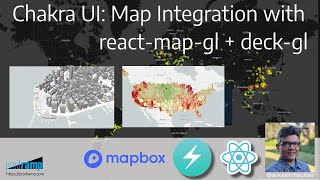
Chakra UI - MAP Integration in React with React-Map-GL and Deck-GL
Learn to integrate interactive maps in React applications using Chakra UI, react-map-gl, and deck.gl. Explore various map layers and visualizations for data-rich, visually appealing map interfaces.
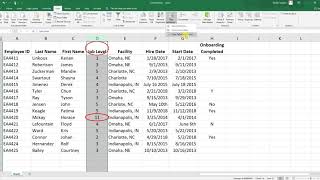
Excel Tutorials
Learn essential Excel techniques for HR data analysis, including data cleaning, statistical tests, and data visualization for effective decision-making.
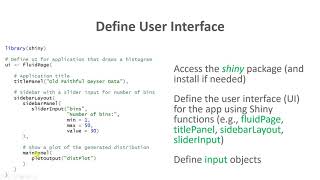
Data Visualization
Learn to create interactive web apps, tables, and various charts in R and Excel for effective data visualization and analysis.