
Charming Data
Connecting Plotly Graphs to Dash Components
Learn to create interactive data visualizations by connecting Plotly graphs with Dash components. Master various chart types and enhance user interaction in your Python-based dashboards.
YouTube4 hours 30 minutesВ любое времяБесплатное видео
650 AI Lab
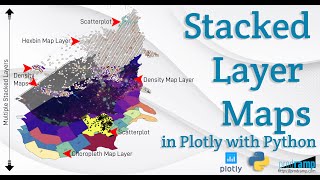
Beautiful and Informative Multilayer Stacked Geo Maps in Plotly With Python
Learn to create multi-layer stacked geo maps in Plotly with Python, combining hexbin, scatter, and density layers for beautiful and informative geospatial data visualizations and dashboards.
YouTube20 minutesВ любое времяБесплатное видео
Samuel Chan
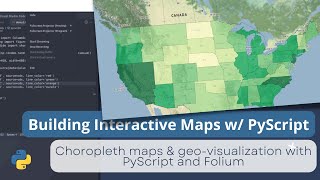
Building an Interactive Map with Folium and PyScript - Tutorial 5
Learn to create interactive maps using PyScript and Folium. Build choropleth visualizations for Indonesia and US unemployment data, then deploy your project on GitHub Pages.
YouTube31 minutesВ любое времяБесплатное видео
The Julia Programming Language
SpatialDependence.jl: Exploratory Spatial Data Analysis - JuliaCon 2024
Explore spatial data analysis with SpatialDependence.jl. Create spatial weights matrices, calculate lags, test autocorrelation, and plot choropleth maps using polygon and point geometries.
YouTube10 minutesВ любое времяБесплатное видео