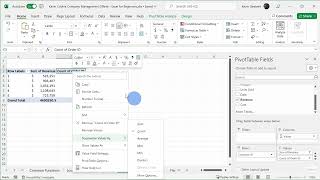
Excel Pivot Tables Tutorial - Lesson 9-1
Master pivot tables in Excel through hands-on demonstrations and practical techniques for analyzing, summarizing, and presenting complex data effectively.
How to Create Pivot Tables from Multiple Excel Worksheets
Master the process of combining and analyzing data from multiple Excel sheets using Power Query and pivot tables to create powerful data summaries and insights.

Microsoft Excel Fundamentals - From Basics to Pivot Tables
Master essential Excel skills from basic data entry to advanced features like pivot tables, formulas, and collaborative tools for improved data analysis and spreadsheet management.
Creating and Customizing Pivot Charts in Excel - From Data Preparation to Advanced Filtering
Master the creation and customization of pivot charts in Excel to transform complex data into dynamic visualizations. Learn data formatting, chart manipulation, and filtering techniques for effective data analysis.

Creating Bar Charts and Column Charts in Microsoft Excel - Data Visualization Tutorial
Master the creation and customization of Excel bar charts, from basic column layouts to stacked variations, while learning essential formatting techniques and shortcuts for professional data visualization.

How to Add and Use Checkboxes in Excel - From Basic Controls to Dynamic Charts
Master the art of creating interactive Excel worksheets with checkboxes, from basic implementation to advanced features like dynamic charts, filtering, and conditional formulas.
Microsoft Excel Copilot - Features, Capabilities, and Analysis
Explore how Copilot enhances Excel workflows through AI-powered data analysis, formula generation, and visualization tools, evaluating its practical benefits and limitations.

Creating Professional Organizational Charts with AI in Bricks - A Step-by-Step Guide
Master the creation of professional organizational charts using Bricks AI tool - transform raw data into customizable, visually appealing charts with real-time updates, styling options, and easy export capabilities.
Creating and Formatting Charts in Microsoft Excel - A Complete Tutorial
Master data visualization techniques in Excel through hands-on practice with charts, from basic line and pie charts to advanced pivot charts and sparklines, including formatting and design tips.

Getting Started with Python in Microsoft Excel - A Beginner's Tutorial
Discover how to leverage Python's powerful data analysis and visualization capabilities directly within Microsoft Excel, from basic syntax to advanced libraries like Pandas and Matplotlib.

Microsoft PowerPoint Tutorial - From Basics to Professional Presentations
Master Microsoft PowerPoint's essential features to create engaging presentations - from basic slide creation to advanced animations, transitions, and recording capabilities for professional-quality results.
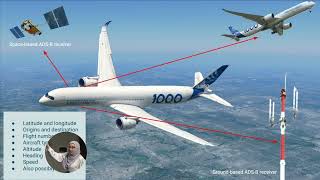
Unlocking the Potential of Data in the Aviation Industry
Explore how aviation industry data flows can revolutionize passenger experiences, airline operations, and sustainability through machine learning and advanced analytics.
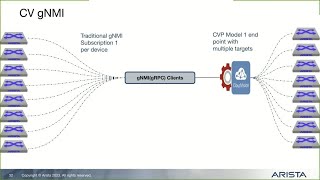
Streaming CloudVision Telemetry to External Sources Using gNMI
Discover how to stream CloudVision telemetry data to external platforms like Influx, Prometheus, and Grafana using gNMI interface for enhanced network monitoring and visualization.
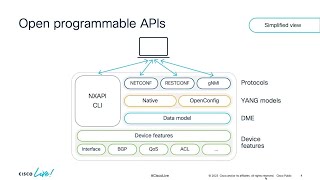
Integrating Streaming Telemetry on Cisco NX-OS with Open Source Tooling
Master network visibility by integrating NX-OS with open-source TIG stack for real-time monitoring, data visualization, and troubleshooting using Grafana dashboards and streaming telemetry.
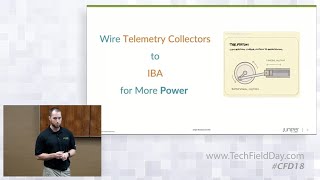
Data Center Analytics with Juniper Apstra - Custom Collectors and Dashboards
Discover how to leverage Apstra's Intent-Based Analytics by creating custom collectors, enriched visualizations, and alerts for enhanced data center monitoring and management.
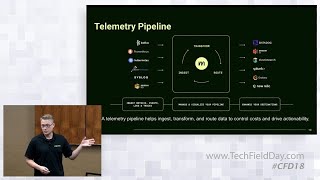
Understand and Optimize Logs, Metrics, Traces, and Events with the Mezmo Telemetry Pipeline
Master telemetry data optimization techniques for DevOps and SREs, covering data profiling, signal isolation, and dynamic pipelines to enhance observability platform performance and reduce costs.
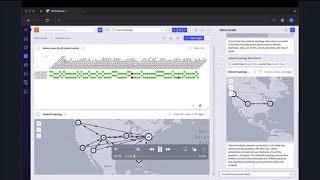
Democratization of Data Access Using Network LLMs with Selector AI
Explore how Selector Copilot leverages AI to analyze network infrastructure, diagnose latency issues, and create custom dashboards for enhanced network monitoring and troubleshooting.
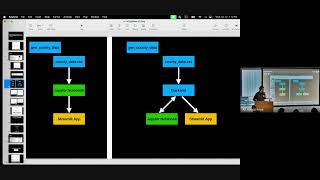
A Python App to Explore COVID-19 Demographics Using Streamlit and Census Data
Explore how to build a Python app using Streamlit and Censusdis to analyze COVID-19's demographic impact across America through interactive data visualization.
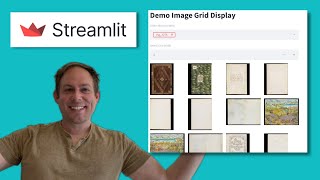
Creating Image Grids in Streamlit Using Columns - Easy Tutorial
Master Streamlit's image grid functionality using columns to display collections of images efficiently in just 30 lines of Python code.

Create DataFrame Applications with Streamlit and Pandas in Python
Learn to create interactive DataFrame applications using Streamlit and Pandas with just two lines of Python code, enabling quick data visualization and manipulation.
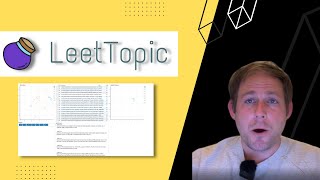
Topic Modeling with LeetTopic - Transformer Topic Modeling and Bokeh App Generation
Learn to implement transformer-based topic modeling using LeetTopic and create interactive Bokeh visualizations for text analysis in Python.