
Crash Course in Data Visualization - Tell a Story With Your Data
Learn effective data visualization techniques to transform insights into impactful stories. Covers chart theory, Python coding with pandas and plotly, and practical tips for creating compelling, interactive visualizations.
Data Visualization in Python with Plotly
Learn to create interactive data visualizations using Plotly in Python, including scatter, bar, line, bubble, histogram, and box plots, with customization techniques for effective data presentation.
Plotly Graphs
Learn to create interactive and visually appealing data visualizations using Plotly in Python, from basic charts to advanced techniques and deployment.

Connecting Plotly Graphs to Dash Components
Learn to create interactive data visualizations by connecting Plotly graphs with Dash components. Master various chart types and enhance user interaction in your Python-based dashboards.

Data Visualization Using Plotly for Python
Learn to create interactive and visually appealing data visualizations using Plotly for Python, covering various chart types and techniques for effective data representation.

Data Viz Using Plotly for R
Learn to create interactive data visualizations with Plotly in R, covering various chart types and customization techniques for effective data presentation.
R Tutorials
Learn essential R skills for data analysis, visualization, and machine learning, covering statistics, deep learning, Plotly, and real-world applications like COVID-19 data extraction.

Plotly Tutorial
Comprehensive tutorial on Plotly for data visualization, covering various chart types, styling options, and advanced features like 3D plots, maps, and animations.
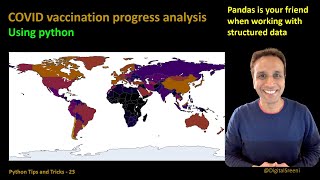
COVID Vaccine Analysis Using Pandas in Python
Analyze COVID vaccination data using pandas in Python, covering data reading, daily and overall analysis, and visualization with Plotly.

Building a Plotly GME Chart in Python
Learn to create an interactive stock chart for GameStop using Python, PlotLy, and AlphaVantage API, exploring the coding process from concept to implementation.
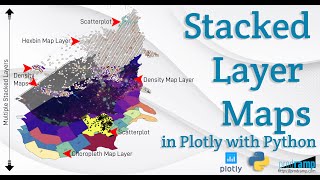
Beautiful and Informative Multilayer Stacked Geo Maps in Plotly With Python
Learn to create multi-layer stacked geo maps in Plotly with Python, combining hexbin, scatter, and density layers for beautiful and informative geospatial data visualizations and dashboards.
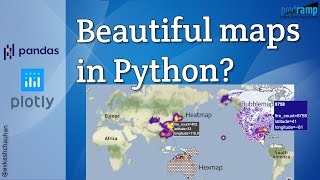
Impactful and Informative Geo Maps With Pandas and Plotly
Create impactful geo maps using Pandas and Plotly. Learn to visualize large datasets with bubble, heat, and hexagon maps. Hands-on tutorial covers data processing, Plotly integration, and map creation techniques.
Time Series Analysis Visualizations with Matplotlib, Seaborn, and Plotly
Explore time series visualization techniques using Matplotlib, Seaborn, and Plotly. Learn to style charts and analyze trends, seasonality, and moving averages in data science applications.

Python for Data Science - Mastering NumPy, Pandas, and Plotly
Comprehensive tutorial on using NumPy, Pandas, and Plotly for data science in Python. Covers core concepts and practical applications with hands-on examples and free resources.

Python for Data Science
Comprehensive guide to mastering Numpy, Pandas, and Plotly for data science in Python. Covers core concepts and practical applications with free, commented code files for hands-on learning.
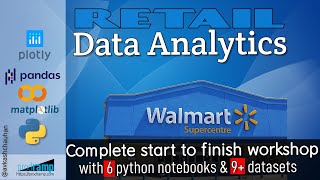
Getting Started with Retail Data Analytics
Develop retail data analytics skills using Python libraries to create consumer profiles, purchase histories, and interactive dashboards with geo-traceable data from 4500+ Walmart stores.
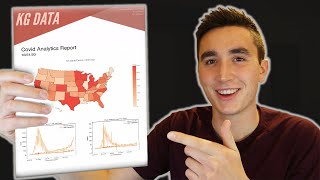
How to Generate an Analytics Report in Python
Learn to create professional analytics reports in Python using FPDF. Generate visually appealing PDFs with custom layouts, images, and data visualizations from libraries like Matplotlib and Plotly.
Creating Quality Control Dashboard Using Python for Manufacturing Issues
Learn to create interactive quality control dashboards for manufacturing using Python, open-source tools, and data visualization libraries like Plotly and Voila.
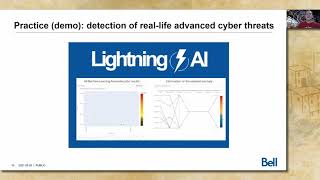
Data Science Way to Deal With Advanced Threats
Explore data science methods for advanced threat detection in SOCs, combining unsupervised and supervised learning to reduce false positives and streamline anomaly triage using ML and interactive visualizations.
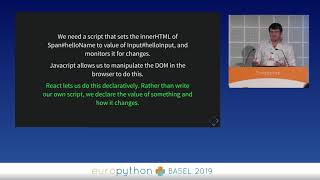
Dash - Interactive Data Visualization Web Apps with No Javascript
Explore interactive data visualization web apps using Dash, a Python framework that eliminates the need for JavaScript. Learn best practices, pitfalls, and when to transition to traditional web development.
Effective Data Visualization
Learn advanced data visualization techniques using Python libraries to effectively communicate complex data across various fields, from choosing plots to aesthetic decisions.