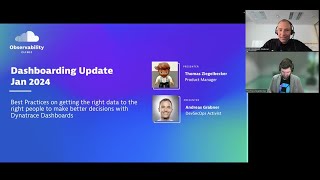
Dynatrace Dashboard Updates - January 2024
Explore new Dynatrace Dashboard App features through a live demo, including advanced threshold visualization, sparkline for timeseries, and enhanced unit formatting.
Plotly Graphs
Learn to create interactive and visually appealing data visualizations using Plotly in Python, from basic charts to advanced techniques and deployment.

Connecting Plotly Graphs to Dash Components
Learn to create interactive data visualizations by connecting Plotly graphs with Dash components. Master various chart types and enhance user interaction in your Python-based dashboards.

Matplotlib Python Tutorial
Learn data visualization with Matplotlib in Python. Master various plot types including line, bar, scatter, histogram, and pie charts to effectively represent and analyze data.

Daily Maths
Comprehensive coverage of essential O Level and IGCSE math topics, including unit conversion, ratios, pie charts, maps, percentages, and interest calculations.

GCSE Maths Revision - Statistics and Probability
Comprehensive statistics and probability revision covering key topics for GCSE exams, including averages, probability trees, charts, and data representation methods.

Plotly Tutorial
Comprehensive tutorial on Plotly for data visualization, covering various chart types, styling options, and advanced features like 3D plots, maps, and animations.

Matplotlib Tutorial
Comprehensive tutorial on Matplotlib, covering various plot types, customization options, and integration with Pandas. Ideal for data visualization in Python.
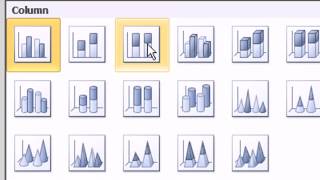
Slaying Excel Dragons - Complete Lessons on Excel Charts
Comprehensive guide to Excel charts: creation, formatting, and advanced techniques. Covers various chart types, data manipulation, and practical applications for effective data visualization.
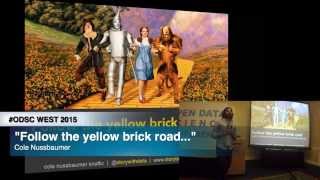
Follow the Yellow Brick Road - What the Wizard of Oz Can Teach You
Learn to craft compelling data stories using visualization techniques, design principles, and storytelling methods to effectively communicate insights and engage your audience.
Creating Simple Graphs in R Studio - Bar, Scatter, and Box Plots
Learn to create bar graphs, scatter plots, pie charts, and box plots using simple R functions for effective data visualization in RStudio.
Microsoft Excel Ultimate Chart Tutorial - 10 of the Most Useful Chart Types Explained
Learn to create and use 10 essential Excel chart types, from histograms to pie charts, with step-by-step guidance for beginners and intermediate users.
Google Data Studio - Basic Data Analyst Course
Learn to utilize Google Data Studio for data analysis, creating charts, and visualizing spatial data with hands-on practice using Maryland crime statistics.

Vega Charts with Dyalog: Data Visualization Using Vega-Lite and APL
Explore Vega-lite for data visualization in APL. Learn to create web-ready charts using JSON grammar, HTMLRenderer, and APL data. Covers various chart types and advanced options.
Descriptive Statistics Concept and With R
Learn descriptive statistics techniques and their implementation in R, covering data summarization, visualization, and basic measures to effectively analyze and present research findings.
Graphs and Descriptive Statistics with R - R Statistical Software Tutorial Videos
Learn to create various graphs and calculate descriptive statistics using R. Master bar charts, boxplots, histograms, scatterplots, and more while customizing plots and adding text and legends.
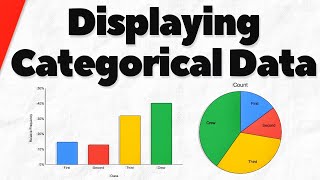
Bar Charts and Pie Charts for Categorical Data in Statistics
Learn to create and interpret bar charts and pie charts for categorical data, exploring frequency tables and comparing visualization methods.
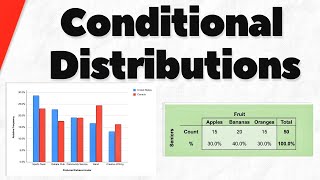
Conditional Distributions of Categorical Variables in Statistics
Explore conditional distributions of categorical variables through examples and charts. Learn to determine associations between variables and interpret data effectively.
Creating a Dynamic Pie Chart Effect Using Lightwave 3D and Adobe After Effects
Learn to craft dynamic pie chart animations by combining Lightwave 3D's modeling capabilities with After Effects' motion graphics tools for visually compelling data presentations.

Introduction to Data Visualisation With D3.js - Full Tutorial
Learn to create powerful web data visualizations using D3.js. Master selections, data binding, charts, scales, axes, and SVG elements to bring your data to life through interactive and visually appealing graphics.
JavaScript Tutorial - Canvas and JSON Data Visualization
Learn to create dynamic pie charts using Canvas and JSON data, covering random color generation, JSON parsing, and advanced Canvas drawing techniques in JavaScript.