Covering Immigration: A Resource for Journalists
Nieman Foundation tends to work with Journalists to advance important conversations on various beats in the industry.
Data Visualization in Tableau
Learn to visualise data using Tableau and build dashboards in Tableau. The tutorial also covers adding a filter in Tableau, adding a secondary axis, blending data and joins in Tableau

Introduction to QGIS
Learn QGIS 3 for geospatial analysis: create 3D models, analyze terrain, visualize data, and produce maps. Master essential GIS skills for various applications in this comprehensive introduction.
Next in Data Visualization - Michelle Borkin - Radcliffe Institute
Explore innovative data visualization techniques across disciplines, enhancing insights and discoveries. Learn about cross-disciplinary collaboration and novel tools for analyzing complex data sets.
Excel Data Analysis Basics Class - Data Analysis & BI Made Easy with Excel Power Tools
Learn Excel data analysis using Power Tools: formulas, PivotTables, Power Query, Power Pivot, and Power BI. Create reports, dashboards, and visualizations for effective business decision-making with real-world datasets.
Power BI Training
Become an expert in Power BI, data and analytics reporting tool, through this tutorial series from Learnit training

Google Earth Pro
Learn to create maps, import shapefiles and coordinates, visualize topography, and convert geospatial data using Google Earth Pro for effective spatial analysis and visualization.
Power BI Crash Course for Beginners - Analyze & Visualize Data with Power BI Desktop
Learn to prepare, analyze, and visualize data using Microsoft Power BI Desktop. This beginner-friendly tutorial covers installation, data connection, query editing, and creating impactful visuals.
Data Analyst Bootcamp
Master SQL, Excel, Tableau, Power BI, and Python for data analysis. Gain practical skills through hands-on projects and build a professional portfolio to launch your career.

ArcGIS Pro Quick-Start Tutorials
Get started in ArcGIS Pro and begin creating projects, exploring features, analyze spatial data, and edit your maps.

Introduction to Geospatial Analysis with Python GeoPandas
Learn to visualize and process geospatial data using Python GeoPandas. Master coordinate conversion, elevation extraction, and geoprocessing techniques for beginners.
Sports Analytics
Explore sports analytics through diverse projects, data scraping, and statistical analyses. Learn to predict outcomes, simulate games, and gain insights into various sports using data science techniques.

Google Sheets Advanced Tutorial
Master advanced Google Sheets techniques: data sorting, filtering, charts, pivot tables, functions (IF, VLOOKUP, SUMIF), macros, and more. Enhance your spreadsheet skills for efficient data analysis and visualization.
Plotly Dash Complete Tutorial
Learn to create interactive dashboards and data-intensive applications with Plotly Dash. Master various components, charts, and styling techniques for building powerful web applications using Python.

Matlab Tutorial
Learn MATLAB basics for data analysis, control systems, and signal processing. Covers variables, operations, scripts, functions, and linear algebra in a beginner-friendly tutorial.
Quality Control and Improvement with MINITAB
This course will emphasize on application of different theories, tools, and techniques for Quality Control and Improvement. Most of the topics will be discussed with relevant problems and solutions in MINITAB 19 software interface.
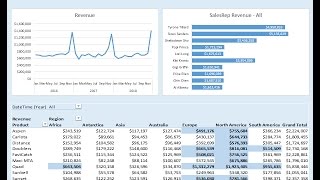
How to Build Excel Dashboard - PivotTable, Chart, Conditional Formatting
Learn to create an Excel dashboard using Power Query, PivotTables, charts, and DAX measures. Master data modeling, conditional formatting, and dynamic updates for effective data visualization and analysis.
Working with SPSS
Learn to use SPSS for data analysis: from data entry and import to advanced statistical techniques like ANOVA, regression, and correlation. Master creating charts and formatting outputs.

R Programming for Beginners - Learn R in 3 Hours
Comprehensive introduction to R programming, covering data types, manipulation, visualization, and neural networks. Includes hands-on examples and a Pokemon case study for practical application.
Data Visualization Tutorial
Learn to create impactful visualizations using Python libraries and tools like Tableau and PowerBI. Hands-on demonstrations cover Matplotlib, Seaborn, and Plotly for effective data presentation and insights.
Visio 2021 Beginner Tutorial
Learn to create diagrams, flowcharts, and organizational charts using Visio 2021. Master shape manipulation, connectors, and advanced features for effective data visualization and professional-looking drawings.