
What Long COVID Taught Me About Life and Data
Discover how data can capture life stories through Giorgia Lupi's personal journey with long COVID. Explore the power of visual narratives in understanding chronic illness and shifting perspectives on data's role in our lives.
Effective Data Storytelling as a Data Scientist in Industry
Learn effective data storytelling techniques for industry presentations. Avoid common mistakes, improve communication of ML models, and craft compelling data stories to enhance stakeholder relationships.
Winning the Room - Creating and Delivering an Effective Data-Driven Presentation
Learn strategies for creating compelling data-driven presentations that engage non-technical audiences. Master techniques to clarify, simplify, and refine your message while maintaining accuracy and maximizing impact.
Change the World with Data - Using Analytics for Community Development and Social Impact
Discover how community developers leverage data storytelling to drive economic impact, track social change, and create sustainable futures through innovative approaches to community development.
Follow the Yellow Brick Road - What the Wizard of Oz Can Teach You
Learn to craft compelling data stories using visualization techniques, design principles, and storytelling methods to effectively communicate insights and engage your audience.
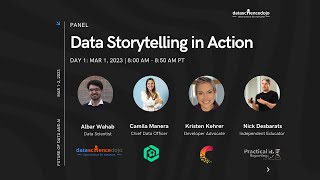
Data Storytelling in Action
Explore data storytelling with industry experts as they discuss visualization techniques, audience engagement, and emerging trends to effectively communicate insights across various fields.
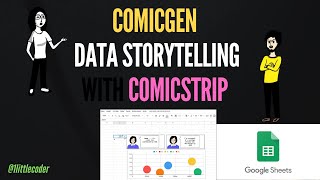
Data Storytelling with ComicStrips - Using ComicGen and Google Sheets
Create engaging data comic strips using Gramener's ComicGen and Google Sheets, enhancing your storytelling skills with visual narratives.
Tableau Basics Advanced Tutorial
Aprenda a criar visualizações avançadas, dashboards interativos e histórias de dados eficazes no Tableau. Domine técnicas de formatação, análise aprofundada e previsão para elevar suas habilidades de análise e visualização de dados.

Tableau Basics Expert Tutorial
Master Tableau essentials: data preparation, advanced visualization techniques, and effective storytelling. Learn to create interactive dashboards, use calculations, and share insights professionally.

The Power of Effective Data Storytelling - Basics for Data Analysis
Learn effective data storytelling techniques to enhance data analysis impact. Discover how to use visualizations, narratives, and creative approaches to make insights more relatable and actionable for businesses.

Effective Data Storytelling - What Does Your Data Tell You - Storytelling with Data
Learn effective data storytelling techniques to transform raw information into compelling narratives. Discover how to analyze, visualize, and communicate insights for evidence-informed decision-making in organizations.
Telling Your Data Story With the 3Vs - Vocabulary, Voice, and Vision - Storytelling with Data
Learn effective data storytelling techniques using the 3Vs: Vocabulary, Voice, and Vision. Improve your ability to create compelling narratives for data management programs and gain support from stakeholders.
Tableau Business Intelligence Expert Tutorial - Advanced Dashboard Techniques
Master Tableau for advanced business intelligence: create interactive dashboards, apply real-world scenarios, and learn expert techniques for insightful data visualization and analysis.
Tableau Data Visualization Professional Tutorial
Comprehensive tutorial on Tableau data visualization, covering dashboard creation, data manipulation, best practices, and sharing techniques for effective and impactful data storytelling.
Data Storytelling for Beginners
Explore effective data storytelling techniques, blending math, science, art, and communication, with real-world examples from Shopify's practices.
Data Storytelling in Python with Vizzu - Interview with Peter Vidos
Explore data storytelling with Vizzu, a Python tool revolutionizing data visualization. Learn to create impactful charts, animate visualizations, and effectively communicate insights for various audiences.
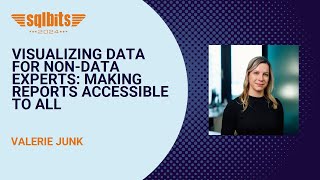
Visualizing Data for Non-Data Experts - Making Reports Accessible to All
Learn to create accessible data visualizations for all audiences. Identify needs, choose appropriate visuals, and present findings clearly and concisely.
PyCon US Lightning Talks - Diverse Python Topics and Experiences
Diverse lightning talks covering Python topics from low-level programming to career development, featuring insights on debugging, mentorship, NumPy 2, data storytelling, automation, and more.
Generative AI and Data Storytelling
Explore the fusion of generative AI and data storytelling, learning techniques to create dynamic narratives from complex datasets and drive business efficiency through AI-aided communication.
Introduction to Generative AI and Data Storytelling
Explore how generative AI enhances data storytelling, creating dynamic narratives from complex datasets. Learn techniques to leverage AI for impactful data communication and business efficiency.

How Not to Build Autonomous Robots
Insider insights on building a Silicon Valley robotics startup, revealing challenges, failures, and lessons learned in autonomous delivery robot development and manufacturing.