Five Tricks for Highly Effective Visualizations in Wolfram Language
Master powerful graphics techniques for stunning Wolfram Language visualizations. Explore styling, lighting, and camera tips to enhance documentation and marketing images.
Scales and Guides: How to Visualize Anything
Visualize data effectively using scales and guides. Learn techniques for categorical, nominal, and ordinal data, plus explore parallel axis plots and scaling functions.
Tabular Data Visualization Techniques for n-Dimensional Data
Explore techniques for visualizing n-dimensional data, including projection and pairwise methods, to effectively convey complex information in 2D or 3D plots.

TableView: Recent Developments in Data Manipulation and Visualization
Explore TableView's recent enhancements for efficient data manipulation, including multi-dimensional headers and customizable typesetting for large datasets.
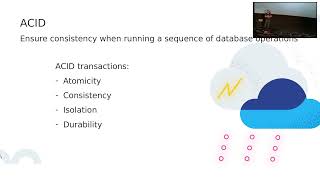
Elasticsearch: What if Your Database Was a Search Engine?
Explore Elasticsearch's database capabilities, including NoSQL features, schema flexibility, and relational functionalities. Learn how it can serve as a powerful data management system beyond search.

Visual Design - Do Not Let Data Be Your Cul-de-sac
Learn best practices for creating clean, aesthetic data visualizations to aid business understanding, tell compelling stories, and drive sustainable decisions.
Unleashing WisePizza - Finding Unusual Segments in Your Data
Explore WisePizza, an open-source library for automated discovery of intriguing data segments. Gain deeper insights, uncover patterns, and revolutionize your data analysis approach.
7 Learnings from Scaling a Data Science Product in PowerBI
Discover key insights on scaling data science products in PowerBI, focusing on AI-driven player experience personalization in the gambling industry.
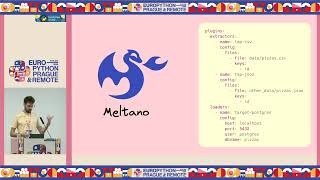
The Rise of the YAML Engineer - Declarative Paradigms in Data Systems
Explore the declarative paradigm in data frameworks, its impact on data practitioners, and the role of YAML. Dive into state management, GitOps, and the future of data engineering.
The What and Why of Microsoft Fabric Real-time Analytics
Explore possibilities with Microsoft Fabric Real-time Analytics, uncovering its potential and applications in data processing and analysis.
Flight of Insights: Navigating Data Turbulence with SQL Modeling and Visualization
Explore data modeling and visualization techniques to identify risks and make informed decisions in project navigation, inspired by Captain Sully's story.
Building and Using Organizational Data Types in Power BI and Excel
Create and utilize data types in Power BI for Excel consumption. Enhance data modeling and visualization capabilities across platforms.
Website Analytics in My Pocket Using Microsoft Fabric
Create a pocket-sized dashboard for website analytics using Microsoft Fabric. Learn to collect API statistics and visualize data in a mobile-friendly Power BI format.
Introduction to Azure Data Studio
Explore Azure Data Studio's features and capabilities for efficient database management and development in this comprehensive introduction.
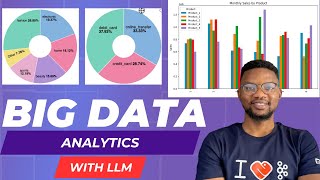
Big Data Analytics with AI: Enhancing Pandas for Advanced Data Processing
Revolutionize data analysis by merging Pandas with AI. Automate cleaning, create smart visualizations, and perform predictive analytics using OpenAI's language models.
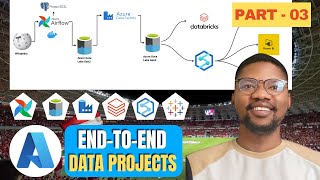
Football Data Analytics with Tableau - Azure Data Engineering Project Part 3
Explore football data engineering: Extract Wikipedia data, store in Azure, migrate with Data Factory, query with Synapse, and visualize in Tableau. Master end-to-end data processes.

Real-Time Threat Detection Using Machine Learning and Apache Kafka
Explore real-time threat detection using machine learning, Apache Kafka, and ksqlDB. Learn about ZIEM, a network mapping and intrusion detection platform that generates instant network diagrams for quick anomaly detection.
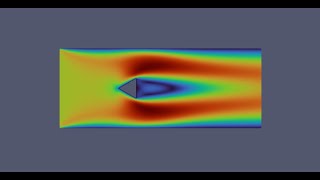
Prism Drag and Lift Calculation and Plotting - OpenFOAM CFD with SimpleFoam
Calculate and plot drag and lift coefficients for prism flow using OpenFOAM CFD and simpleFoam. Learn advanced techniques for analyzing fluid dynamics and aerodynamics.
Seeing is Believing - Using Diagrams to Communicate Complex Ideas with Python
Explore techniques for creating effective diagrams and visuals to simplify complex project concepts, enhance documentation, and improve team communication using Python and various tools.

Combining Django ORM and FastAPI in a Single App
Explore combining Django ORM with FastAPI in a single app. Learn practical insights, implementation strategies, and lessons from real-world experience in this unconventional setup.
Ask Your Logs - Structured Logging for Rails Applications
Explore structured logging techniques to transform Rails logs into actionable data, enabling efficient debugging and insightful analysis of production issues.