Python Seaborn Complete Tutorial for Beginners
Master data visualization with Python's Seaborn library. Learn to create scatter plots, line charts, box plots, and more through step-by-step tutorials and practical examples.
Seaborn Python Tutorial
Learn data visualization with Seaborn: create scatter plots, line charts, and distribution plots. Master regression models, FacetGrid, and color palettes for effective data analysis and presentation.

Connecting Plotly Graphs to Dash Components
Learn to create interactive data visualizations by connecting Plotly graphs with Dash components. Master various chart types and enhance user interaction in your Python-based dashboards.

Data Visualization Using Plotly for Python
Learn to create interactive and visually appealing data visualizations using Plotly for Python, covering various chart types and techniques for effective data representation.
Data Visualization with ggplot2 in R
ggplot2 is the most popular package for data visualization. It is based on Grammar of Graphics which makes visualization extremely easy.

Matplotlib Python Tutorial
Learn data visualization with Matplotlib in Python. Master various plot types including line, bar, scatter, histogram, and pie charts to effectively represent and analyze data.
Tableau Tutorial
Learn Tableau's key features, architecture, and data visualization techniques including charts, plots, and KPIs for effective business intelligence analysis.
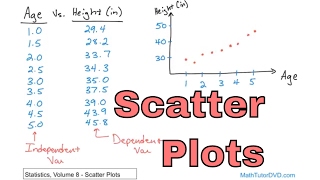
Statistics - Vol 8
Comprehensive exploration of statistical concepts including scatter plots, correlation, linear regression, and multiple regression, with practical Excel applications and in-depth analysis techniques.
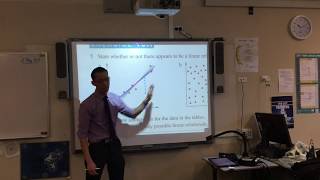
Bivariate Data Analysis
Explore scatter plots, correlation coefficients, and lines of best fit to analyze relationships between two variables in this comprehensive introduction to bivariate data analysis.

Data Viz Using Plotly for R
Learn to create interactive data visualizations with Plotly in R, covering various chart types and customization techniques for effective data presentation.

Plotly Tutorial
Comprehensive tutorial on Plotly for data visualization, covering various chart types, styling options, and advanced features like 3D plots, maps, and animations.

How I Make Beautiful Graphs and Plots Using LaTeX
Learn to create professional-quality graphs and plots using LaTeX and pgfplots, covering 2D and 3D visualizations, customization techniques, and data importing for enhanced scientific and mathematical presentations.
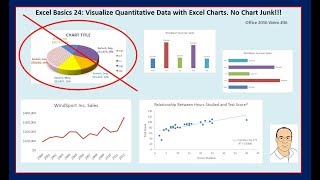
Excel Basics - Excel Charts & Graphs to Visualize Quantitative Data
Learn to create effective Excel charts and graphs for data visualization, focusing on best practices and avoiding chart junk. Explore various chart types and their applications in data analysis.
Python Seaborn Tutorial in Hindi
हिंदी में Seaborn डेटा विज़ुअलाइज़ेशन लाइब्रेरी का व्यापक परिचय। लाइन प्लॉट, हिस्टोग्राम, बार प्लॉट, स्कैटर प्लॉट, हीटमैप और पेयरप्लॉट जैसे विभिन्न प्रकार के ग्राफ़ बनाना सीखें।

Python for Data Visualization in Hindi - Data Visualization - Python Tutorial
हिंदी में पायथन का उपयोग करके डेटा विज़ुअलाइज़ेशन सीखें। विभिन्न प्रकार के प्लॉट बनाने के लिए मैटप्लॉटलिब और सीबॉर्न लाइब्रेरी का उपयोग करें, जैसे लाइन, बार, स्कैटर, हिस्टोग्राम और बॉक्स प्लॉट।
Going Beyond Observability - Grafana for Data Analysis and Visualization
Discover how Grafana evolves beyond monitoring to become a comprehensive data analysis platform, featuring new visualization tools and enhanced transformation capabilities for diverse analytical needs.
Follow the Yellow Brick Road - What the Wizard of Oz Can Teach You
Learn to craft compelling data stories using visualization techniques, design principles, and storytelling methods to effectively communicate insights and engage your audience.
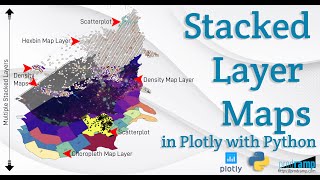
Beautiful and Informative Multilayer Stacked Geo Maps in Plotly With Python
Learn to create multi-layer stacked geo maps in Plotly with Python, combining hexbin, scatter, and density layers for beautiful and informative geospatial data visualizations and dashboards.
Linear Regressions with StatsModels - Data Science Tutorial
Learn to create linear regressions using StatsModels, exploring datasets and examples with NumPy, Pandas, Matplotlib, and Seaborn. Analyze professor ratings and tipping strategies through practical applications.
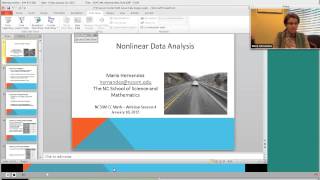
Nonlinear Data Analysis for Teachers - Professional Development
Explore nonlinear data analysis techniques for real-world applications, including residual assessment, inverse function linearization, and implementation of CCSS Mathematical Practices with web resources.
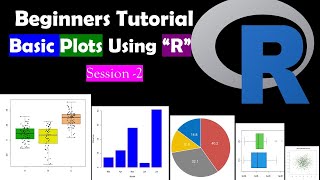
Creating Simple Graphs in R Studio - Bar, Scatter, and Box Plots
Learn to create bar graphs, scatter plots, pie charts, and box plots using simple R functions for effective data visualization in RStudio.