
Introduction to QGIS
Learn QGIS 3 for geospatial analysis: create 3D models, analyze terrain, visualize data, and produce maps. Master essential GIS skills for various applications in this comprehensive introduction.
R for Bioinformatics
Learn to convert Ensembl IDs to gene symbols and create heatmaps using R packages like biomaRt and pheatmap, essential skills for bioinformatics data analysis and visualization.
Transcriptomics
Comprehensive guide to RNA-Seq analysis, covering data processing, visualization techniques like volcano plots and heatmaps, and practical applications using R and Galaxy.
Visualization With Seaborn
Learn to create powerful data visualizations using Seaborn, covering joint kernels, heatmaps, swarm plots, and more. Enhance your Python graphing skills with this comprehensive tutorial.
Data Visualization
Learn to create volcano plots and heatmaps in R for bioinformatics analysis. Reproduce Galaxy tutorials and master essential data visualization techniques for beginners.
Data Visualization in R
Learn to create impactful volcano plots and heatmaps for bioinformatics using R, with step-by-step guidance on reproducing Galaxy tutorials and utilizing the pheatmap package.
Gene Expression Analysis
Learn essential techniques for analyzing gene expression data, including RNA-Seq pipelines, volcano plots, heatmaps, and RNAseq data analysis using R and Python.
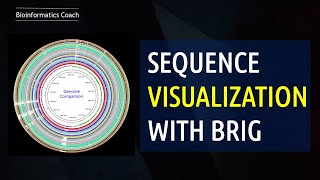
Genome Visualization
Explore genome visualization techniques using tools like BRIG, CGView, Artemis, and Python. Learn to create volcano plots, analyze pangenomes, and generate heatmaps for bioinformatics research.

RStudio Tutorial
Comprehensive RStudio tutorial covering statistical analysis, data visualization, bioinformatics, machine learning, and more. Ideal for beginners and advanced users seeking practical skills in R programming.
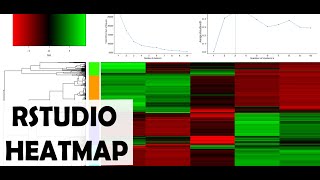
Bioinformatics
Comprehensive bioinformatics tutorials covering RNA-seq analysis, data visualization, statistical methods, and cancer genomics using R and other tools.
Python Seaborn Tutorial in Hindi
हिंदी में Seaborn डेटा विज़ुअलाइज़ेशन लाइब्रेरी का व्यापक परिचय। लाइन प्लॉट, हिस्टोग्राम, बार प्लॉट, स्कैटर प्लॉट, हीटमैप और पेयरप्लॉट जैसे विभिन्न प्रकार के ग्राफ़ बनाना सीखें।
Conversion Rate Optimization Course in Hindi
Comprehensive guide to conversion rate optimization in Hindi, covering tools, metrics, landing pages, e-commerce, CTAs, design patterns, and Microsoft Clarity, with practical tips and common mistakes.
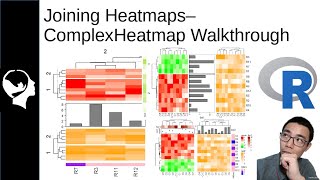
Joining Multiple Heatmaps - ComplexHeatMap Tutorial
Learn to combine multiple heatmaps in R using ComplexHeatmap. Master horizontal and vertical merging, customization, and annotations for effective data visualization in bioinformatics.
Running Basic Statistical Analysis in R
Learn to perform essential statistical analyses in R, including correlation, linear modeling, t-tests, and heatmaps. Ideal for beginners seeking to leverage R's powerful command-line interface for data analysis.
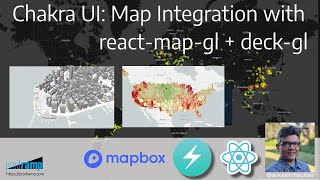
Chakra UI - MAP Integration in React with React-Map-GL and Deck-GL
Learn to integrate interactive maps in React applications using Chakra UI, react-map-gl, and deck.gl. Explore various map layers and visualizations for data-rich, visually appealing map interfaces.

Powerful Generics Added - Grid System in Unity
Learn to implement powerful C# generics in Unity's grid system for versatile game development applications like heatmaps, pathfinding, and building areas.
Grid System in Unity - Heatmap, Pathfinding, Building Area
Learn to implement a versatile Grid System in Unity for heatmaps, pathfinding, and building areas. Gain practical skills to enhance your game development toolkit.
Advance Deep Learning Workshop for Satellite Imagery - Model Export & Production
Hands-on workshop on advanced deep learning techniques for satellite imagery, covering remote debugging, model deployment, activation heatmaps, and custom predictions using TensorFlow and Keras.
Crippen's logP as a Quantitative Molecular Benchmark for Explainable AI Heatmaps
Explore Crippen's logP as a quantitative benchmark for explainable AI heatmaps in molecular modeling. Learn about atomic attribution methods and their applications in chemical property prediction.
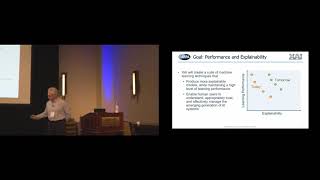
DARPA's Explainable Artificial Intelligence - XAI Program
Explore DARPA's Explainable AI program, its goals, strategies, and applications in machine learning, autonomy, and deep learning. Gain insights into the future of transparent AI systems.
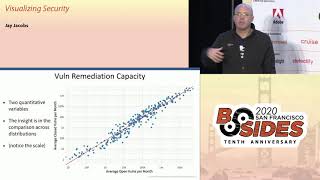
Visualizing Security
Explore data analysis and visualization techniques for security through real-world examples, covering various chart types and data transformation methods to enhance security insights.