Data Visualization Tutorial
Learn to create impactful visualizations using Python libraries and tools like Tableau and PowerBI. Hands-on demonstrations cover Matplotlib, Seaborn, and Plotly for effective data presentation and insights.

Complete Python Playlist
Comprehensive guide to Python programming, covering basics to advanced topics, data science libraries, and practical projects for becoming an expert developer.

Seaborn Tutorial
Comprehensive tutorial on Seaborn data visualization library, covering various plot types, styling options, and real-world examples for effective data representation and analysis.

Python Machine Learning for Beginners - Machine Learning with Python 2023
Comprehensive introduction to machine learning with Python, covering NumPy, Pandas, Matplotlib, and Seaborn libraries. Learn data manipulation, visualization techniques, and essential concepts for beginners.

Python Tutorial in Telugu
Learn Python in Telugu in this tutorial by Great Learning.
Visualization With Seaborn
Learn to create powerful data visualizations using Seaborn, covering joint kernels, heatmaps, swarm plots, and more. Enhance your Python graphing skills with this comprehensive tutorial.
Seaborn- Understanding the Weird Parts
Explore advanced data visualization techniques using Seaborn, covering various plot types and statistical analyses for effective data representation and insights.
Python Seaborn Complete Tutorial for Beginners
Master data visualization with Python's Seaborn library. Learn to create scatter plots, line charts, box plots, and more through step-by-step tutorials and practical examples.

Intro to Seaborn
Comprehensive video series on Seaborn data visualization library, covering various plot types, styling options, and advanced features for effective data representation in Python.
Seaborn Python Tutorial
Learn data visualization with Seaborn: create scatter plots, line charts, and distribution plots. Master regression models, FacetGrid, and color palettes for effective data analysis and presentation.

Python for Data Science - Data Science Tutorials for Beginners
Learn how to read data, process it, visualize and create reports. We also have our primary focus on Python to help you have your biggest leap into Data Science.
Data Visualization Using Python in Seaborn
Learn to create statistical graphics in Python using Seaborn. Master line plots, bar plots, scatterplots, histograms, joint plots, and box plots for effective data visualization and analysis.
Python for Analytics - Numpy, Pandas, Matplotlib, Seaborn
Comprehensive guide to Python analytics libraries: Numpy, Pandas, Matplotlib, and Seaborn. Includes hands-on projects, interview prep, and practical applications for data analysis and visualization.
Deep Learning Tutorial with Python
Comprehensive tutorial on deep learning with Python, covering essential libraries, machine learning concepts, neural networks, and computer vision with practical demonstrations and examples.
Machine Learning with Python for Beginners
Learn Python libraries, machine learning concepts, regression techniques, Naive Bayes, and deep learning fundamentals. Gain practical skills through demonstrations and examples to kickstart your machine learning journey.

Machine Learning Full Course for Beginners
Comprehensive introduction to machine learning, covering key concepts, algorithms, and practical applications using Python libraries. Ideal for beginners seeking a solid foundation in ML.
Data Science Your First Day
Learn essential data science skills: GitHub, Colab, data analysis, visualization, and CI/CD. Hands-on practice with real-world datasets and tools for efficient workflow and collaboration.

Matplotlib & Seaborn 入門講座
Pythonでデータ可視化をマスター。Matplotlib & Seabornを使って、折れ線、棒、円グラフなど多様なグラフ作成技術を学び、実践的なデータ分析スキルを身につける。
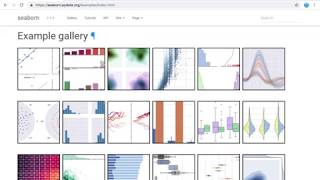
파이썬 Python Seaborn 으로 시각화 하기
Seaborn을 활용한 데이터 시각화 기법 학습: 다양한 그래프 유형, 시계열 데이터 처리, 통계 분석 시각화, 서브플롯 생성 등 실용적인 기술 습득
Python Ile Grafik Dersleri Veri Görselleştirme Matplotlib & Seaborn & Pandas
Python ile veri görselleştirme: Matplotlib, Seaborn ve Pandas kütüphaneleri kullanarak çizgi, saçılım, bar, histogram ve yoğunluk grafikleri oluşturmayı öğrenin. Veri bilimi ve analiz için temel beceriler kazanın.
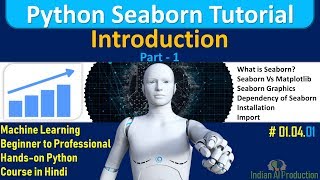
Python Seaborn Tutorial in Hindi
हिंदी में Seaborn डेटा विज़ुअलाइज़ेशन लाइब्रेरी का व्यापक परिचय। लाइन प्लॉट, हिस्टोग्राम, बार प्लॉट, स्कैटर प्लॉट, हीटमैप और पेयरप्लॉट जैसे विभिन्न प्रकार के ग्राफ़ बनाना सीखें।