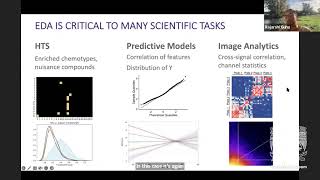
Integration then Interrogation: Exploratory Data Analysis on a Deadline - 2022
Explore strategies for efficient exploratory data analysis, focusing on visualization techniques, predictive modeling, and practical constraints in chemical biology datasets.
Python Seaborn Complete Tutorial for Beginners
Master data visualization with Python's Seaborn library. Learn to create scatter plots, line charts, box plots, and more through step-by-step tutorials and practical examples.

Intro to Seaborn
Comprehensive video series on Seaborn data visualization library, covering various plot types, styling options, and advanced features for effective data representation in Python.
Seaborn Python Tutorial
Learn data visualization with Seaborn: create scatter plots, line charts, and distribution plots. Master regression models, FacetGrid, and color palettes for effective data analysis and presentation.

Matplotlib Python Tutorial
Learn data visualization with Matplotlib in Python. Master various plot types including line, bar, scatter, histogram, and pie charts to effectively represent and analyze data.

Python for Data Visualization in Hindi - Data Visualization - Python Tutorial
हिंदी में पायथन का उपयोग करके डेटा विज़ुअलाइज़ेशन सीखें। विभिन्न प्रकार के प्लॉट बनाने के लिए मैटप्लॉटलिब और सीबॉर्न लाइब्रेरी का उपयोग करें, जैसे लाइन, बार, स्कैटर, हिस्टोग्राम और बॉक्स प्लॉट।
The Google Guide to Exploratory Data Analysis - With Code
Learn to apply Google's Exploratory Data Analysis guide using productivity data, covering data cleaning, visualization, and statistical techniques for insightful analysis and feature selection.
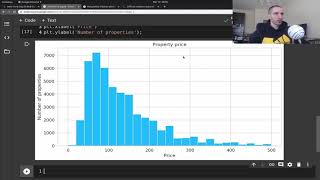
Data Visualization Tutorial for Beginners with Matplotlib in Python - Exploratory Data Analysis
Explore fundamental data visualization techniques using Matplotlib and Seaborn in Python. Learn to create histograms, box plots, violin plots, bar charts, line charts, scatter plots, and more for effective exploratory data analysis.