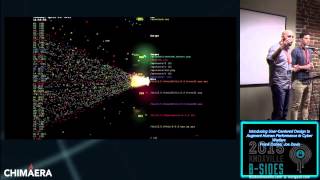
Introducing User Centered Design to Augment Human Performance in Cyber Warfare
Explore user-centered design principles for enhancing cyber warfare performance, covering research methods, data visualization techniques, and practical applications in the field.
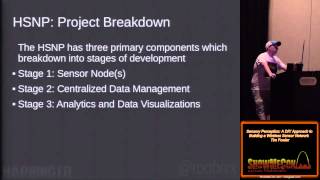
Sensory Perception - A DIY Approach to Building a Wireless Sensor Network
Explore DIY wireless sensor networks: design, build, and manage a resilient system for data collection and analysis, with practical insights on node placement and visualization.
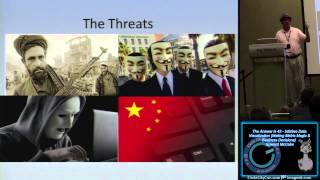
The Answer is 42 - InfoSec Data Visualization Making Metric Magic Business Decisions
Explore InfoSec data visualization techniques to transform security metrics into actionable business insights, enhancing decision-making and communication with leadership.
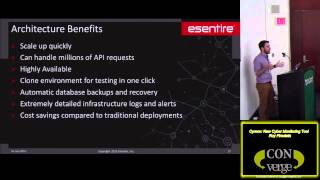
Cymon New Cyber Monitoring Tool
Explore Cymon, a new cyber monitoring tool for threat intelligence, featuring event tracking, visualizations, and machine learning capabilities for enhanced cybersecurity.
What Would Fix Passwords - Some Weekly Password Audits - Pretty Graphs to Prove It - A Haiku
Explore password security through audits, graphs, and a unique haiku presentation, offering insights into effective password management and protection strategies.
Intro to Data Science for Security
Learn data science fundamentals for cybersecurity, including techniques for analyzing and visualizing security data to detect threats and enhance defenses.
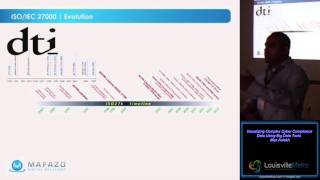
Visualizing Complex Cyber Compliance Data Using Big Data Tools
Explore big data tools for visualizing complex cyber compliance data, covering historical perspectives, current trends, and holistic approaches to enhance security and attack correlation.
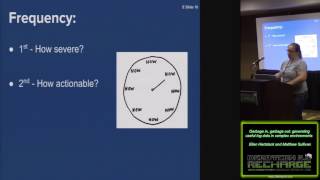
Garbage in Garbage Out - Generating Useful Log Data in Complex Environments
Explore effective log data generation in complex environments, focusing on meaningful data, thresholds, and log management systems for improved security and analysis.
Detecting DNS Anomalies with Statistics
Explore statistical methods for detecting DNS anomalies, including letter analysis, unique queries, and outlier identification. Learn practical tools and techniques for enhancing network security.

Analyzing Pwned Passwords with Apache Spark
Learn to analyze compromised passwords using Apache Spark, exploring data visualization, password policies, and big data security challenges for improved cybersecurity practices.
CacheBleed - A Timing Attack on OpenSSL Constant Time RSA
Explore a timing attack on OpenSSL's constant-time RSA implementation, uncovering vulnerabilities in cryptographic systems and their potential impact on security.
Scalable Scanning and Automatic Classification of TLS Padding Oracle Vulnerabilities
Explore TLS padding oracle vulnerabilities, their history, and detection methods. Learn about scanning techniques, vulnerability identification, and real-world implications for web security.
From Cradle to Grave - The Life of Machine Data
Explore machine data lifecycle: generation, transfer, storage, and analysis. Learn tools and practices for handling large-scale data, with live demo on MQTT, CrateDB, visualization, and machine learning applications.
Bridging the Gap Between AI and UI
Explore methods for understanding AI model predictions and their input features, with a focus on RNN in NLP. Learn novel ideas for incorporating visualizations to enhance user experience and retention.
Data, Design, Code
Explore the process of creating web-based data visualizations, from topic selection and data preparation to designing visual encodings, with insights on using D3.js for custom, impactful visualizations.
Kandinsky Patterns for Visual Concept Learning
Explore visual concept learning through Kandinsky patterns, focusing on medical image interpretation, symmetry, heatmaps, and decision trees for enhanced pattern recognition and analysis.

All Your Telemetry Data from Any Source in One Place
Learn to centralize telemetry data using OpenTelemetry standards and New Relic's platform. Hands-on labs cover data ingestion, visualization, and custom dashboard creation for efficient monitoring and issue resolution.
Stefanie Posavec on Data Visualization
Explore data-driven design and innovative visualization techniques with expert Stefanie Posavec. Learn to communicate messages beyond statistical insights through creative data representation projects.
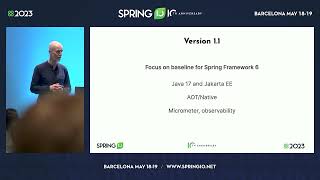
Observing Spring for GraphQL in Action
Explore Spring for GraphQL's latest features and observability support through a sample application, demonstrating data fetching visualization and GraphQL request processing insights.

Maths - The Fun Parts
Explore fun mathematical concepts through programming, including Sets, Groups, and Graphs. Discover the joy of abstract math ideas by writing code to understand their inner workings.
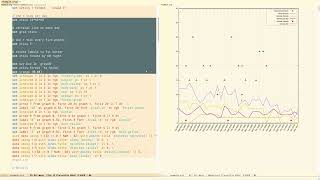
Health Data Journaling and Visualization with Org Mode and GNUplot
Learn to use Org Mode and GNUplot in Emacs for health data journaling and visualization. Explore techniques for daily tracking, data organization, and creating insightful charts to monitor personal health metrics.