
Health Data Journaling and Visualization with Org Mode and Gnuplot
Explore health data journaling and visualization using Org Mode and gnuplot, with insights on tracking medications, parameters, and long-term trends for personal health management.
Prometheus - For Both Big and Little People
Explore Prometheus monitoring for small and large deployments, covering data collection, service discovery, alerting, storage, and visualization with Grafana.
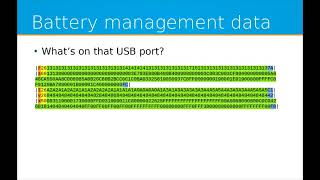
Decoding Battery Management Data - Back in the Old School
Explore decoding battery data from an electric motorbike using Raspberry Pi, Python, and open-source tools. Learn techniques for interpreting binary data from closed systems without documentation.
DAING - A Monitoring Stack for Datacentres
Explore a comprehensive monitoring stack for datacentres using Icinga, Netbox, Ansible, and Grafana. Learn to document, manage, and monitor infrastructure at scale in this hands-on lab session.

Election Night Analysis - Art or Science
Explore statistical methods for predicting Australian election results with ABC analyst Antony Green. Learn about data sources, assumptions, and robust processes used to call elections before official counts are finalized.

Performance Testing of Prometheus Based Metric Platforms
Discover how Hootsuite evaluated Prometheus and Grafana metrics platforms using load testing, and learn about their Locust-based framework for assessing performance impacts of configuration changes.
Rethinking Web UI's with WebGL
Explore Makepad, an experimental livecoding environment using WebGL for UI rendering. Learn about its architecture, GPU-compiled JS, and innovative approaches to styling and data visualization.
Visualizing the Ethereum Blockchain
Explore a Visa project visualizing Ethereum blockchain using React libraries, bringing clarity to complex technology through sensory experience and interactive data representation.

Data Driven Storytelling
Explore how leading media executives leverage data to craft compelling narratives, enhance storytelling, and shape content strategies in the digital age.
Custom Metrics with Pushgateway, Prometheus and Grafana
Explore custom metrics implementation using Pushgateway, Prometheus, and Grafana for effective monitoring and visualization of system performance and data analysis.
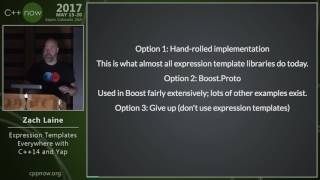
Expression Templates Everywhere with C++14 and Yap
Explore expression templates using C++14 and Yap, a proposed Boost library. Learn implementation techniques, benefits, and lessons from modern C++ features for efficient template programming.
No Raw std::thread! - Live Tweet Analysis in C++
Explore concurrent algorithms for complex interactions in C++ using a live tweet analysis app. Learn to apply algorithms for values distributed in time and space without raw std::thread.
Effective Data Visualization
Learn advanced data visualization techniques using Python libraries to effectively communicate complex data across various fields, from choosing plots to aesthetic decisions.
Decoding Bias and Narrative in Competitive Video Games
Explore video analysis of Overwatch eSports broadcasts to uncover biases and narratives in competitive gaming, examining player focus and storytelling techniques.
Datos, Python y Humanos
Explorando retos y oportunidades de la ciencia de datos en Latinoamérica: historias reales, obstáculos comunes y visión de futuro para científicos de datos y empresas en la región.
From Spreadsheets to DataFrames
Learn to transition from spreadsheets to Python DataFrames, exploring web scraping, data processing, analysis, and visualization using popular libraries like Pandas and Matplotlib. Gain skills for efficient data management and problem-solving.
Dashboards for All
Learn to create interactive dashboards using Python libraries like Bokeh and Panel. Explore data visualization techniques, analyze diverse datasets, and tell compelling stories through customized, user-friendly interfaces.
Effective Data Visualization
Mastering data visualization: from choosing plots to preprocessing datasets. Learn to effectively communicate data using Python libraries like seaborn, matplotlib, and plotly. Covers density estimation, dimensionality reduction, and interactive plotting.

Animating NFL Play by Play Data Using Matplotlib's FuncAnimation
Learn to create engaging data animations using matplotlib's FuncAnimation() with NFL play-by-play RFID data. Discover how animations enhance analysis, convey complex information, and build context in data visualization.
Leveraging a Custom CPython Data Model for High Performance
Explore high-performance microprocessor design using a custom CPython data model for efficient data analysis, visualization, and problem-solving in integrated circuit development.
Network Analysis Made Simple
Learn network analysis fundamentals using diverse datasets. Explore construction, summarization, visualization, and problem-solving with complex networks. Gain insights applicable to social media, epidemiology, and more.