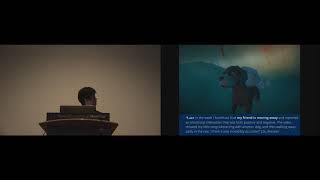
A Trip to the Moon - Personalized Animated Movies for Self-reflection
Explore how personalized animated movies can enhance self-reflection by visualizing mood and behavior data, leading to greater emotional engagement and deeper introspection.

The Web as Art
Explore innovative storytelling through web-based art projects, including the groundbreaking "We Feel Fine," as artist Jonathan Harris shares his creative vision and techniques.

New Insights on Poverty
Explore innovative data visualization tools revealing global poverty trends and income distribution, challenging preconceptions about economic development across countries.

The Best Stats You've Ever Seen
Hans Rosling uses Gapminder to debunk myths about world development, presenting statistics with sportscaster-like drama and urgency in this engaging TED talk.

Debunking Third-World Myths with the Best Stats You've Ever Seen
Engaging statistical presentation challenging misconceptions about global development using innovative data visualization techniques and compelling storytelling.

A Dashboard Is Worth a Thousand Words - Better Monitoring for Better Ops
Explore how CERN's new monitoring system improved service operations and fostered SRE practices, discussing design decisions, operational challenges, and the benefits of implementing SLIs/SLOs.
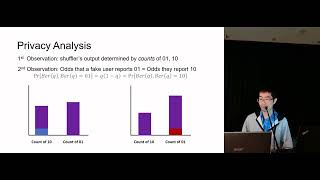
Differentially Private Histograms in the Shuffle Model from Fake Users
Explore innovative techniques for creating privacy-preserving histograms using fake users in the shuffle model, enhancing data protection and analysis capabilities.

The Card10 Badge - Two Years of Evolution
Explore the evolution of the card10 badge, a wearable bio-sensor device, with new firmware features, improved Bluetooth connectivity, and expanded applications like indoor climate sensing and ECG monitoring.
Best Practices for Creating Stunning R Visuals in Power BI
Learn to create stunning data visualizations in Power BI using R programming, enhancing your data storytelling capabilities with the grammar of graphics concept and best practices for R visuals.

The Cloud Native Journey at Adobe
Explore Adobe's cloud-native journey: migrating enterprise products to Kubernetes, implementing DevOps, and leveraging tools like Envoy, Helm, and Prometheus for improved automation and visibility.
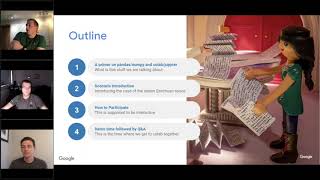
Exploring the Wonders of Timesketch and Jupyter
Harness the power of notebooks and Timesketch to solve forensic challenges. Learn data analysis, visualization, and API integration for effective digital investigations.

Science in the Browser - Orchestrating and Visualising Neural Simulations
Explore real-time 3D visualizations of brain cell electrical activity using cloud computing and JavaScript, bridging neuroscience with web development for accessible open-science research.

Hooked on D3 - Create Animated Charts with D3 and React Hooks
Learn to create dynamic, animated charts by combining D3 and React Hooks. Discover techniques for responsive data visualization, balancing control between D3 and React for optimal performance and interactivity.

Visualizing the Medical Data Explosion
Explore cutting-edge tools for analyzing vast medical imaging data, including virtual autopsies and futuristic technologies, revolutionizing how doctors interpret patient information.
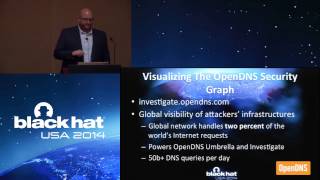
Unveiling the Open Source Visualization Engine for Busy Hackers
Open source engine for creating advanced data visualizations, enabling visual learners to interpret complex data sets efficiently. Useful for security practitioners, incident responders, and malware researchers.
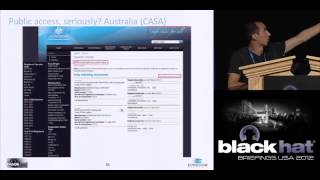
Ghost is in the Air - Traffic - Security Aspects of ADS-B and "Flying" Technology
Explore security vulnerabilities in ADS-B technology and potential threats to air traffic control systems, including practical demonstrations of data injection and visualization techniques.
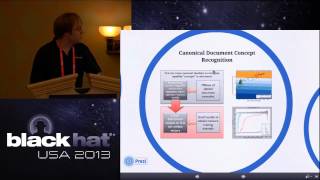
CrowdSource - Crowd Trained Machine Learning Model for Malware Capability Detection
Innovative machine learning tool for automated malware capability detection, trained on web technical documents. Provides probabilistic and traceable output for rapid reverse engineering of active malware variants.

The Development Metrics You Should Use but Don't
Explore innovative development metrics to navigate uncertainty, predict outcomes, and articulate trade-offs in software projects using data-driven insights and probability-based approaches.
Data Mesh - Data-Driven Value at Scale
Explore data mesh principles for delivering data-driven value at scale. Learn about domain-oriented ownership, data as a product, and the earliest explorable data concept to transform organizational data handling.
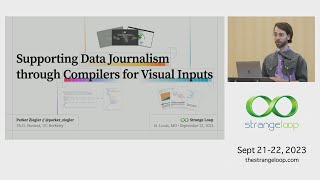
Supporting Data Journalism Through Compilers for Visual Inputs
Explore innovative compilers for visual inputs in data journalism, focusing on projects that transform data graphics and thematic maps into interactive programs for newsrooms.

Beat to 1337 - Creating a Successful University Cyber Defense Organization
Learn to build a successful university cyber defense organization, covering motivation, competitions, tools, and strategies for student-led learning and skill development in cybersecurity.