
A Gentle Introduction to Pandas Data Analysis
Learn essential Pandas skills for data analysis in Python, covering data structures, manipulation, and visualization. Perfect for beginners seeking to master this crucial data science tool.
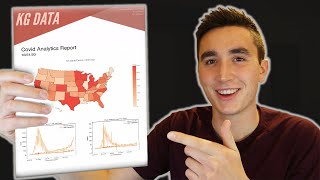
How to Generate an Analytics Report in Python
Learn to create professional analytics reports in Python using FPDF. Generate visually appealing PDFs with custom layouts, images, and data visualizations from libraries like Matplotlib and Plotly.
Unsupervised Machine Learning - Flat Clustering with KMeans with Scikit-Learn and Python
Explore flat clustering with KMeans using Scikit-learn and Python. Learn to categorize unlabeled data into specified groups through hands-on coding and visualization techniques.
Python for Machine Learning - Machine Learning Tutorial for Beginners
Comprehensive introduction to Python libraries for machine learning, covering NumPy, Pandas, and Seaborn. Includes practical implementations of algorithms and data visualization techniques.

Python for Machine Learning - Machine Learning for Beginners
Explore essential Python libraries for machine learning, including NumPy for numerical computation, Pandas for data manipulation, and Seaborn for visualization. Gain practical skills through demos and Q&A.
Python for Machine Learning - Machine Learning Tutorial for Beginners
Comprehensive introduction to Python for machine learning, covering essential libraries like NumPy, Pandas, and Seaborn. Includes practical examples and guidance for beginners.
Data Analysis of Amazon Reviews - Data Mining
Learn to scrape and analyze Amazon reviews using Python, covering web scraping techniques, data preprocessing, and visualization for valuable e-commerce insights.

Analyzing IPL Data Using Python
Learn to analyze IPL data using Python, pandas, matplotlib, and seaborn. Gain hands-on experience in data visualization and exploratory analysis while developing practical Python skills.
Python for Machine Learning - Machine Learning Tutorial - Python Tutorial
Explore Python libraries for machine learning, including NumPy, Pandas, and Seaborn. Learn data manipulation, visualization, and practical ML implementation through examples and hands-on demonstrations.
Python Basics for Machine Learning - Day 2 of Kaggle's 30 Days of ML Challenge
Learn Python fundamentals for machine learning, covering data manipulation, visualization, and deep learning tools in this comprehensive 30-day challenge.
Android Smartphone Data Analysis in R
Learn to analyze Android smartphone usage data using R, from downloading Google Takeout data to creating visualizations for app usage comparisons across time periods.
Getting Started with Scientific Programming for Humanities Analytics
Introduction to scientific programming using Python, covering basics of language, shell, IDE, and Jupyter Notebooks. Learn to create lexicons, functions, and plots for text analysis in humanities research.

Big Query Live Training - A Deep Dive Into Data Pipelining
Explore data pipelining with BigQuery: learn to process, analyze, and visualize large datasets efficiently. Gain hands-on experience in extracting, loading, and transforming data for marketing insights.
Looker Studio Tutorial for Google Analytics 4 - GA4 + Google Data Studio
Comprehensive guide to connecting GA4 with Looker Studio, creating visualizations, and building interactive reports. Learn essential components and practical tips for effective data analysis.

Introduction to R
Learn R programming basics, including its advantages, interface, and essential functions for data analysis and visualization in biology.
Enhancing the Performance Testing Process for gRPC Model Inferencing at Scale
Explore performance testing for gRPC model inferencing at scale using Kubernetes, KServe, and ModelMesh. Learn about deployment, load testing, and monitoring key metrics.
Envoy Metrics Demystified - Hands-on Workshop
Hands-on workshop exploring Envoy proxy metrics for application insights. Learn about topology, connection metrics, PromQL basics, and create Grafana dashboards through practical scenarios with HTTP and gRPC endpoints.
Timebase CE: Open Source Time-Series Data Warehouse for Crypto Exchanges
Explore TimeBase CE: open-source time-series data warehouse for building analytical models and applications, with focus on crypto exchange connectivity and community-driven development.
Dealing with Verification Data Overload in OpenJDK Projects
Explore data visualization and deep learning techniques to efficiently process and analyze massive test logs, enabling quick problem identification and improved monitoring of complex CI/CD pipelines.
Enable Serverless Metrics in Apache OpenWhisk on Kubernetes with Prometheus
Learn to enable serverless metrics in Apache OpenWhisk on Kubernetes using Prometheus. Explore system and user metrics, understand OpenWhisk's structure, and see a live demo of metric collection and visualization.

Code a JavaScript Timeline - Interactive Web Development
Build an interactive timeline with HTML, CSS, and JavaScript. Learn to render, style, expand, add, and delete timeline information in this hands-on coding session.