Service Mesh Without the Mess - Implementing Cilium Service Mesh with eBPF
Explore service mesh implementation using Cilium and eBPF, covering monitoring, tracing, and performance optimization for distributed systems like Kubernetes.
Rust for Artists Workshop - Introduction to Creative Coding
Discover Rust for creative coding: Learn language fundamentals and explore Nannou framework to build interactive digital art, games, and sculptures with this artist-focused introduction.
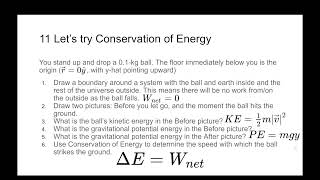
Graphing Energy Using VPython for Physics 1
Learn to visualize energy concepts through VPython coding, enhancing your understanding of physics principles and computational skills.
Modeling Data in Jupyter Notebook
Harness Python's power in Jupyter to analyze lab data, create models, and visualize results. Learn essential data manipulation techniques for physics research and experimentation.
Importing Data from VPython into Tracker - Tracker for Beginners Part 8
Learn to import VPython data into Tracker for easy comparison, enhancing your physics analysis capabilities and streamlining data visualization processes.
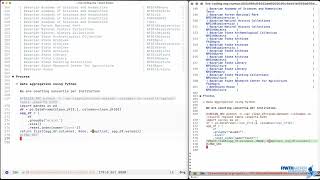
Collaborative Data Processing and Documenting Using Org-Babel - EmacsConf 2023
Explore collaborative data processing and documentation using org-babel in Emacs. Learn techniques for cleaning, processing, and visualizing data while preserving workflows.
Building a Stock Simulator Using Taipy
Build a stock simulator using Taipy, a Python framework for creating interactive web applications with data visualization and analysis capabilities.
C# ASP.NET Core 3 Voting System - Statistics Interactor - Lecture 10
Develop a statistics interactor for a voting system using C# ASP.NET Core 3, focusing on displaying vote statistics in this beginner-friendly tutorial.

Legend Function in Matplotlib - Python Programming
Learn to effectively use the legend function in Matplotlib to enhance data visualization, including customization options and best practices for clear and informative plots.

Build and Deploy a React Admin Dashboard with Real-time Data and Features
Comprehensive React admin dashboard tutorial covering authentication, data visualization, CRUD operations, and Kanban board implementation using Refine Framework for efficient development.
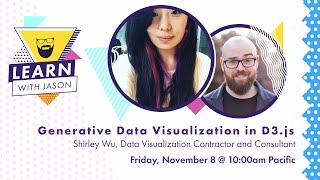
Generative Data Visualization in D3.js - Learn With Jason
Explore data visualization techniques with Shirley Wu, transforming decisions into stunning computer-generated art using D3.js. Learn to create beautiful, informative visualizations from raw data.
Introduction to InfluxDB 2 and Flux - Rawkode Live
Comprehensive introduction to InfluxDB 2 and Flux, covering installation, configuration, metrics exploration, dashboards, tasks, and alerting. Ideal for those interested in time series data management and analysis.
Introduction to Timescale - Getting Started with Time-Series Data
Comprehensive introduction to TimescaleDB, covering setup, data import, querying, and advanced geospatial time series analysis with hands-on demonstrations and expert insights.

Learn Looker Studio - Beginner Course
Comprehensive tutorial on Looker Studio: build dashboards, explore data, and learn pro tips. From basics to advanced design, create eye-catching visualizations in just 47 minutes.
How to Create Resource Modifiers and Resource Filters in FilamentPHP - FilamentPHP for Beginners
Learn to enhance FilamentPHP forms and tables with resource modifiers and filters. Master techniques for improved UI, data validation, and efficient data management in Laravel applications.
Let's Learn D3.js - Data Visualization with JavaScript
Learn to create interactive data visualizations with D3.js. Explore techniques for building dynamic, engaging charts and graphs using JavaScript and SVG in this hands-on tutorial.
Introduction to Data Visualization with ggplot2
Learn to create powerful data visualizations using R's ggplot2 package. Master customization, choose optimal charts, leverage segmentation, and export high-quality graphics for analysis and presentations.

Intro to Data Visualization with R and ggplot2
Learn to create powerful data visualizations using R and ggplot2. Master customization, choose optimal charts, leverage segmentation, and export high-quality graphics for impactful data analysis and presentation.

Introduction to R Programming for Excel Users
Learn to apply Excel skills in R programming for data analysis, visualization, and advanced techniques. Discover how Excel concepts translate to R, enabling powerful data manipulation and insights.
Intro to R Visualizations in Microsoft Power BI - R Visualizations in Power BI
Learn to create dynamic R visualizations in Power BI, enhancing data exploration and analysis capabilities. Hands-on introduction covers ggplot2, data preprocessing, and integrating R with Power BI's interface and controls.
Unstructured Text With Python, Microsoft Cognitive Services & PowerBI
Explore text analytics and sentiment analysis using Python, Microsoft Cognitive Services, and Power BI. Learn industry applications, overcome challenges, and visualize results beyond tag clouds.