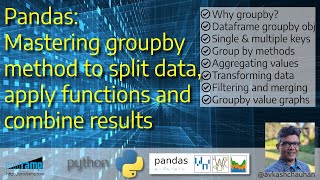
Mastering Pandas Groupby Method to Split and Combine Data and Apply Functions
Learn to expertly use pandas groupby for data manipulation, including splitting, combining, applying functions, and creating visualizations from grouped data.
Getting Started with Retail Data Analytics
Develop retail data analytics skills using Python libraries to create consumer profiles, purchase histories, and interactive dashboards with geo-traceable data from 4500+ Walmart stores.
How to Speed Up Your Pandas Code and Save Time and Resources
Learn to accelerate Pandas code 2-5x using Modin, a drop-in replacement that utilizes all CPU cores. Compare performance, explore use cases, and understand technical details for efficient data processing.
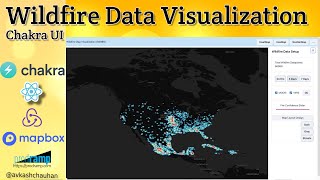
How to Visualize Global Wildfire Data on Front-End Using Chakra UI
Learn to visualize global wildfire data using Chakra UI and React. Create interactive maps, integrate real-time data, and build a user-friendly interface for exploring wildfire patterns and trends.
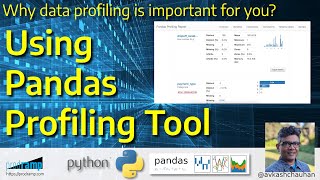
Python Pandas Profiling - Why Data Profiling Is Important for You
Learn to generate detailed, interactive dataset reports using pandas-profiling. Explore column details, interactions, correlations, and more with just a few lines of code.
React 3D Portfolio Website with Three.js - Build and Deploy Responsive React Portfolio
Create a stunning 3D portfolio website using React and Three.js. Learn responsive design, animations, contact forms, and how to integrate 3D models for a unique and interactive showcase of your work.
Introduction to Data Visualisation With D3.js - Full Tutorial
Learn to create powerful web data visualizations using D3.js. Master selections, data binding, charts, scales, axes, and SVG elements to bring your data to life through interactive and visually appealing graphics.
VPython for Beginners - Graphs - Lecture 36
Explore VPython's graphing capabilities in this tutorial. Learn the three-step process for creating basic graphs and discover various plotting options for data visualization.
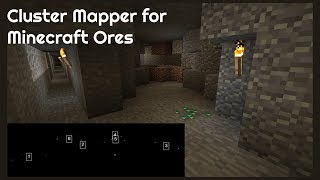
Cluster Mapper for Minecraft Ores - Python Visualization Tool
Visualize Minecraft ore locations with Python: Learn to create a 3D cluster mapper using VPython for efficient mining and exploration.
VPython for Beginners - Importing Data from Tracker
Learn to import and visualize Tracker data in VPython, enhancing physics simulations with real-world measurements for accurate comparisons and analysis.
JavaScript Tutorial - Canvas and JSON Data Visualization
Learn to create dynamic pie charts using Canvas and JSON data, covering random color generation, JSON parsing, and advanced Canvas drawing techniques in JavaScript.

Qt Tutorial - Qt Charts
Learn to create various charts in Qt, including bar, pie, and line charts, with detailed coverage of chart attributes and customization options.
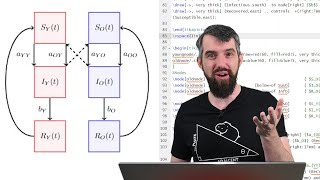
Creating Beautiful Math Graphics with TikZ and LaTeX
Learn to create stunning mathematical diagrams using Tikz in LaTeX. Master lines, shapes, colors, nodes, and advanced techniques for precise and professional-looking graphics in your documents.
Python for Finance - Introduction to Stock Market Analysis
Learn to analyze stock market data using Python, covering Numpy, Pandas, Matplotlib, data manipulation, statistical calculations, and visualization techniques for financial analysis.
Canceling Edit in React Material UI Table
Implement cancel edit functionality in React Material UI Table, enhancing user experience with error handling and form management techniques.
Identifying Market Trends With Web Data - Practical App Programming Tutorial
Learn to analyze market trends using web data, manage large datasets, optimize code, perform calculations, and create visualizations in this practical programming tutorial.

Intro to Data Analysis - Visualization with Python, Matplotlib and Pandas - Matplotlib Tutorial
Learn Python data analysis and visualization using Matplotlib and Pandas. Covers installation, data importing, plotting techniques, and real-world population growth analysis.

Powerful Generics Added - Grid System in Unity
Learn to implement powerful C# generics in Unity's grid system for versatile game development applications like heatmaps, pathfinding, and building areas.
Grid System in Unity - Heatmap, Pathfinding, Building Area
Learn to implement a versatile Grid System in Unity for heatmaps, pathfinding, and building areas. Gain practical skills to enhance your game development toolkit.

How to Create a Data Table in Node RED Dashboard
Learn to create and customize data tables in Node-RED Dashboard, from installation to dynamic updates. Explore real-world data handling, row management, and table configuration for effective data visualization.

Detect Text in Images with Python - Pytesseract vs. EasyOCR vs. Keras OCR
Comprehensive comparison of pytesseract, easyocr, and keras_ocr for extracting text from images using Python, with practical examples and performance analysis.