Data Manipulation with Dplyr
Learn efficient data manipulation using dplyr in R. Master essential functions for filtering, aggregating, and joining datasets, enhancing your data analysis skills with practical examples.
Data Visualization and Storytelling with PowerBI
Learn to create impactful, interactive data stories using Power BI. Discover techniques for visually compelling narratives that engage audiences and emphasize key points through effective data visualization.
Business Data Analysis with Excel - Excel for Data Analysis
Learn robust business data analysis using Excel. Explore histograms, running records, and process behavior charts to analyze trends, compare data, and derive insights without programming or advanced statistics.

Intro to Azure ML and Cloud Computing
Explore Azure ML Studio's cloud-based data science capabilities, from data upload and visualization to preprocessing and cleaning, using its intuitive graphical interface.
End-to-End Sustainability: Driving User Engagement from Pre to Post-Install - Sustainable Growth Day 2019
Discover strategies for sustainable growth in mobile apps, from optimizing onboarding to fostering long-term user engagement and commitment.
Generative Data Visualization with SVG, Vue, and D3.js - Part 3
Explore custom data visualization techniques using SVG, Vue, and D3.js with expert Shirley Wu. Learn to create interactive and visually appealing representations of complex datasets.
Metabase - A Simple Data Analytics System with Complex Capabilities
Explore Metabase: A free, open-source data analytics platform with intuitive GUI and multi-database support. Learn installation, setup, and usage for powerful, user-friendly data analysis.
Hands-on Workshop: Getting Started with Fluent Bit and Metrics with Prometheus
Practical workshop on integrating Fluent Bit with Prometheus for enhanced observability. Learn to collect, send, and visualize metrics using Grafana in a cloud-native environment.
Bringing Data Visualization to Backstage: Software Analytics and Developer Insights
Explore software analytics visualization in Backstage, enhancing developer experience with insights from code repositories, issue trackers, and CI/CD pipelines using open-source tools and Vega.js.
Tableau Data Visualization Full Course Tutorial
Comprehensive Tableau tutorial covering data visualization techniques, from basic charts to advanced dashboards. Learn to connect data, create various chart types, customize visuals, and share impactful results.

Encoding Discourse - Novel Interfaces for Collaborative Decision-Making
Explore innovative interfaces for collaborative decision-making using the Tactile Matrix, an illuminated, machine-readable system for real-time computation and dynamic projection-mapping.
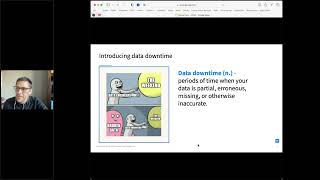
Beyond Monitoring - The Rise of Data Observability - Shane Murray
Explore data observability as a solution to data downtime, ensuring data trust at scale. Learn its importance in modern DataOps and gain insights for implementing a robust data quality strategy.
Interactive Brokers API and TradingView Charts in Python
Learn to integrate TradingView Lightweight Charts with Interactive Brokers API in Python. Build projects for data visualization, real-time updates, and automated trading with hands-on coding examples.

Immersive Analytics and Embodied Sensemaking
Explore emerging display and interaction technologies for data visualization, focusing on immersive analytics and embodied sensemaking techniques to enhance data understanding and analysis.
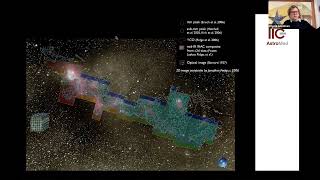
Exploring High Dimensional Data in Astronomy, Genomics and Beyond Using Glue
Discover "glue," a powerful analysis/visualization tool for exploring diverse datasets across fields. Learn its origins, capabilities, and applications in astronomy, genomics, and beyond.
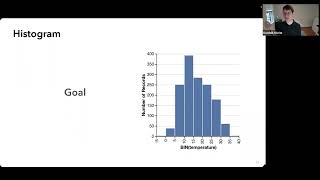
Vega: Layered Abstractions for Data Visualizations
Explore Vega's ecosystem of declarative visualization languages and interactive tools for creating rich, interactive visualizations with layered abstractions and flexible designs.
Tableau Data Visualization Master Tutorial
Master Tableau's data visualization tools, from basics to advanced techniques. Learn to create interactive dashboards, custom reports, and effective visualizations for impactful data analysis and presentation.
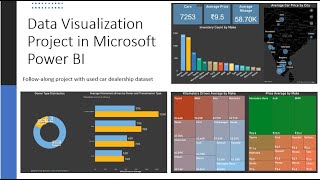
Visualize Used Car Data in Microsoft Power BI - Follow Along Data Analysis Project
Learn to visualize used car data in Power BI. Import data, create visuals, and customize reports in this step-by-step tutorial. No prior experience needed.
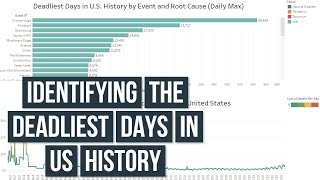
Building a Dataset for the 487 Most Deadly Days in US History
Explore data analysis techniques to identify and visualize the deadliest days in US history, using GitHub datasets and Tableau for impactful visualizations.
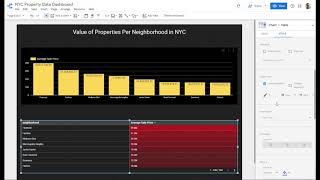
Building a Real Estate Data Dashboard Product in Google Data Studio 2020
Create a dynamic real estate data dashboard using Google Data Studio to visualize market trends and property insights for informed decision-making.
Google Data Studio - Basic Data Analyst Course
Learn to utilize Google Data Studio for data analysis, creating charts, and visualizing spatial data with hands-on practice using Maryland crime statistics.