Tableau Data Visualization Intermediate Tutorial
Comprehensive guide to intermediate Tableau techniques, covering advanced chart types, map visualizations, and data manipulation for enhanced data analysis and presentation skills.
Tableau Data Visualization Beginner Tutorial
Learn to connect data sources, create various charts, and master essential Tableau features for powerful data visualization and analysis.
Inferencing Big Data with AI and Machine Learning in Metaverse
Explore advanced visualization techniques for big data in AR/VR, focusing on real-time inferencing, infrastructure needs, and cognitive AI agents for enhanced customer engagement.
Musical Charts: Using Open Source Software to Make Data Visualizations Accessible to Visually Impaired Users
Explore innovative open-source solutions for making data visualizations accessible to visually impaired users, enhancing chart accessibility beyond industry standards.
Visualizing Success - Year One of the OpenVis Collaboration Space
Explore the achievements of the Open Visualization Collaboration Space, focusing on advancements in JavaScript data visualization libraries like deck.gl and kepler.gl. Discover cutting-edge visualization technology.
A Beginner's Guide to Open Source Metrics and Analysis
Learn essential open source metrics and analysis techniques, covering data challenges, GitHub bots, accountability, privacy, and best practices for meaningful insights.
Community Data: What to Measure and Why
Explore data science techniques for extracting meaningful insights from open source community metrics, enhancing decision-making and advocacy in the evolving landscape of community management.
Uncovering Community and Project Insights Through Data-Driven Methods
Explore data-driven methods to assess open source project health using GitHub data. Learn to create dashboards and ML models for deeper insights into software development processes.
Customized Trace Data Visualization with KernelShark - How to Write User Plugins
Learn to create custom trace data visualizations using KernelShark plugins. Explore basic concepts, visualization models, and practical examples for enhanced data analysis and interpretation.
Breaking Out of the Proprietary Cage - Real-time Data Warehouses in Open Source
Explore real-time data warehouses in open source, focusing on ClickHouse's architecture, performance optimization, and integration patterns for modern analytics applications.
Prepping the Bar - Insights from Cleaning and Labeling a Cocktail Dataset
Explore data cleaning and labeling techniques using a cocktail dataset, gaining insights for effective data preparation in business analytics projects.
Real-time Trade Data Processing and Machine Learning at Giga-Scale with Hazelcast and FINOS Perspective
Explore scalable real-time trade data processing using Hazelcast and FINOS Perspective. Learn to architect high-performance applications combining streaming data, reference data, and machine learning for front and back office use-cases.
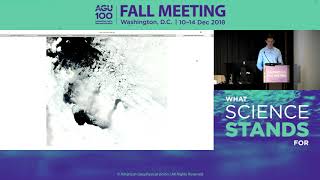
NASA's Worldview: Creating Custom Maps and Animations with Satellite Data
Hands-on workshop teaching how to create custom maps and animations using NASA's satellite imagery to visualize environmental changes, disasters, and air quality.
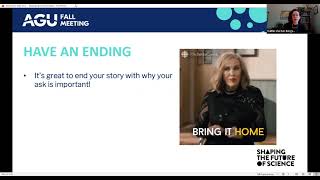
Storytelling for Policymakers: Crafting Compelling Narratives - Part 3
Learn to craft compelling stories for policymakers, focusing on narrative techniques, audience engagement, and effective communication methods to make your issue memorable and actionable.
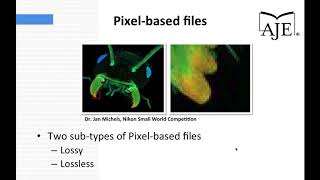
Creating Effective Figures for Scientific Posters
Learn essential techniques for crafting impactful scientific poster figures with expert guidance on design, clarity, and visual communication.
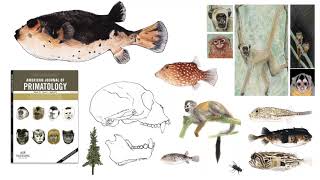
Balancing Design and Content in Scientific Posters and Figures
Explore effective scientific poster design with expert insights on aesthetics, data visualization, and balancing visual appeal with research content.
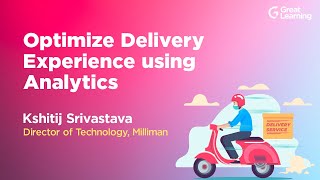
Optimize Delivery Experience Using Analytics
Learn to leverage analytics and visualization for data-driven decision-making. Explore essential components, problem-solving techniques, and create powerful Tableau dashboards to optimize delivery experiences.

Sensing the Whole - Big Data, Big Indicators and the Future of Planetary Health
Explore emerging tools like satellite imagery and analytics that reveal complex relationships between people and the planet, enabling new approaches to planetary health and social wellbeing.

The Power of Effective Data Storytelling - Basics for Data Analysis
Learn effective data storytelling techniques to enhance data analysis impact. Discover how to use visualizations, narratives, and creative approaches to make insights more relatable and actionable for businesses.

Effective Data Storytelling - What Does Your Data Tell You - Storytelling with Data
Learn effective data storytelling techniques to transform raw information into compelling narratives. Discover how to analyze, visualize, and communicate insights for evidence-informed decision-making in organizations.
Telling Your Data Story With the 3Vs - Vocabulary, Voice, and Vision - Storytelling with Data
Learn effective data storytelling techniques using the 3Vs: Vocabulary, Voice, and Vision. Improve your ability to create compelling narratives for data management programs and gain support from stakeholders.