
Google Earth Pro Fundamentals and Advanced Features Course
Learn to navigate Google Earth Pro, plan trips, create custom maps, and explore advanced features like recording tours and analyzing geographical data.

Microsoft Power BI Desktop for Beginners - 4-Step Tutorial
Comprehensive tutorial guiding beginners through Power BI Desktop, from installation to publishing. Learn data import, transformation, integration, and visualization techniques to create insightful dashboards.

How to Use Excel - A 3-Hour Path to Confidence and Skills
Comprehensive Excel tutorial covering basics to advanced features. Learn formulas, data management, visualization, and analysis techniques to boost productivity and confidence in spreadsheet skills.
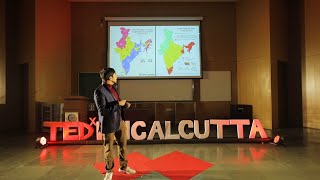
Telling India's Story One Map at a Time
Explore how data visualization and storytelling can unveil India's diverse facets, as Ashris Choudhury shares his journey of creating impactful infographics and maps to engage audiences and communicate complex societal issues.

Microsoft Excel Intermediate Class - Elevate Your Skills
Elevate your Excel skills with advanced features like Autofill, Flashfill, data sorting, filtering, IF functions, and conditional formatting for improved data analysis and workflow efficiency.
GROUPBY Excel Function: Creating Single Cell Reports - 11 Examples
Master Excel's GROUPBY function for instant single-cell formula reports. Learn advanced techniques like custom headers, subtotals, conditional formatting, filtering, and dynamic inputs to enhance your data analysis skills.
10 Excel Pro Tips: Waterfall Charts, MATCH Function, and More
Master 10 essential Excel skills: waterfall charts, MATCH function, file management, and more. Boost productivity with step-by-step tutorials for beginners and intermediate users.
Tableau Business Intelligence - Advanced Techniques and Dashboard Creation
Master advanced Tableau techniques for creating insightful dashboards. Learn to analyze world population data, explore USA colleges, and develop powerful visualizations for real-world business scenarios.

Tableau Business Intelligence Expert Tutorial - Advanced Dashboard Techniques
Master Tableau for advanced business intelligence: create interactive dashboards, apply real-world scenarios, and learn expert techniques for insightful data visualization and analysis.

Excel for Finance and Accounting - Advanced Tutorial
Advanced Excel techniques for finance professionals, covering NPV, IRR, charts, Pivot Tables, and real-world exercises on financial statements. Improve workflow and data visualization skills for practical financial tasks.

Effectively Communicating Your Findings - Mastering the Art of Research Communication
Learn practical tips for structuring presentations, creating compelling visuals, and delivering research findings with clarity and conviction in both in-person and virtual settings.
Ultimate Excel Tips and Tricks - 4 Hour Tutorial
Comprehensive Excel mastery: design better spreadsheets, boost productivity with 20 tips, break bad habits, and enhance data visualization through advanced chart formatting techniques.

Excel for Finance and Accounting - Beginner Tutorial
Learn essential Excel skills for finance and accounting, including functions, charts, and tools like Pivot Tables. Apply knowledge to real-world financial statements and improve workflow efficiency.

Wildlab: Addressing Communication Barriers in Online Science Communication
Exploring innovative approaches to enhance online science communication and data visualization accessibility through automated tools and user-centric design.
Visual Pattern Exploration At and Across Scales
Innovative visualization systems for exploring patterns in large-scale datasets, combining interactive visual techniques with machine learning to enhance data analysis in genomics, geospatial, and time-series fields.
10 Essential Excel Techniques for Dynamic Charts and Pivot Tables
Master essential Excel skills: dynamic charts, pivot tables, slicers, heat maps, and more. Step-by-step tutorials for beginners and intermediate users to enhance data analysis and visualization capabilities.
Tableau Data Visualization Professional Tutorial
Comprehensive tutorial on Tableau data visualization, covering dashboard creation, data manipulation, best practices, and sharing techniques for effective and impactful data storytelling.

Visualizing the Spread of Hoaxes - Innovative Technology in Misinformation Analysis
Innovative technology visualizes hoax propagation, revealing patterns and impact. Big data analyst Ismail Fahmi explores the pervasive nature of misinformation and its spread in the modern digital landscape.

Data Sketches: A Year of Exotic Data Visualizations
Explore a year-long data visualization journey, uncovering insights on creative processes, overcoming challenges, and transforming ideas into compelling visual stories.
Sbud - Information Visualization in Information Security
Explore innovative data visualization techniques for enhancing information security analysis and communication, presented by expert Ange Albertini at Hack.lu 2023.

PowerPoint Essentials: A Beginner's Step-by-Step Tutorial
Learn to create impressive presentations: from basics to advanced features, including design, images, charts, animations, and effective delivery techniques.