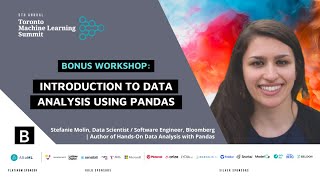
Introduction to Data Analysis Using Pandas
Learn to effectively analyze data using pandas in Python. Master data manipulation, aggregation, and visualization techniques for extracting valuable insights from tabular datasets.

Football Data Analytics: Azure End-to-End Data Engineering Project
Extract, clean, and analyze football data using Apache Airflow, Azure services, and Tableau. Build a comprehensive data pipeline from Wikipedia to interactive visualizations.
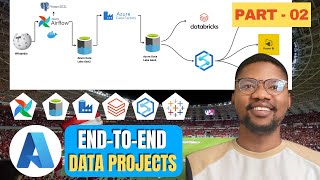
Football Data Analytics: Azure End-to-End Data Engineering Project - Part 2
Extract, store, and analyze football data using Azure services and Apache Airflow. Develop end-to-end data engineering skills through hands-on implementation of a real-world project.
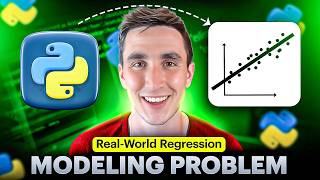
Predicting Healthcare Insurance Costs with Python - Real-World Data Science Problem Solving
Predict healthcare insurance costs using Python and machine learning. Clean data, visualize with pandas, and apply scikit-learn for linear regression in this hands-on tutorial with real-world data analysis.

Monitoring, Logging, and Security in DevOps
Implement monitoring, logging, and security in DevOps with hands-on exercises using Prometheus, Grafana, and CI/CD pipeline security measures.
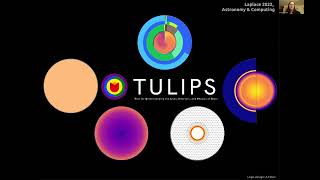
Visualizing MESA Models with TULIPS - How to Python
Learn to visualize MESA stellar evolution models using TULIPS Python package. Create plots and animations showing changes in stars over time. Enhance understanding of stellar structure and evolution.
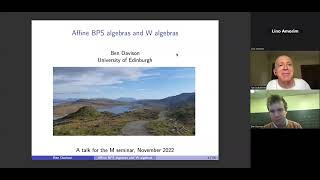
Affine BPS Algebras and W Algebras - Lecture on Quiver Potentials and Cohomological Hall Algebras
Explore affine BPS algebras, W algebras, and their connections to quiver representations, cohomological Hall algebras, and Yangians in this advanced mathematical seminar.
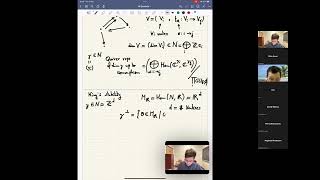
Quivers, Flow Trees, and Log Curves
Explore the connection between Donaldson-Thomas invariants, attractor flow trees, and log Gromov-Witten invariants in quiver theory and toric geometry.
Data in our Day to Day: Beyond the Basics
Explore advanced data concepts and applications in otolaryngology, enhancing clinical decision-making and research practices beyond fundamental principles.

Discovery in High Dimensions - 2008
Explore statistical methods for uncovering hidden structures in high-dimensional data from various fields, including genetics, astronomy, and consumer behavior.

Complete Session on Knowledge Graph and GraphDB with LangChain
Comprehensive exploration of Knowledge Graphs and GraphDB integration with LangChain, covering implementation techniques and practical applications for advanced data management and AI systems.
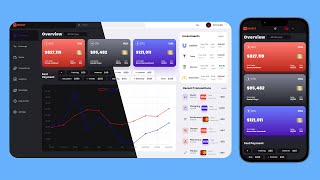
Build and Deploy a Responsive Multi-Page Crypto Investment Dashboard - HTML, CSS, and JavaScript
Develop a responsive multi-page crypto investment dashboard with HTML, CSS, and JavaScript. Learn to create light/dark themes and deploy the project online.
Improving Steering and Verification in AI-Assisted Data Analysis with Interactive Task Decomposition
Explore advanced techniques for enhancing AI-assisted data analysis through interactive methods and improved verification processes for more accurate analytical outcomes.
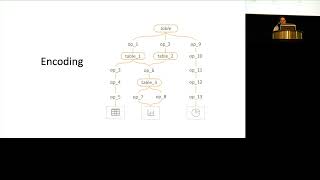
Monitoring and Steering Conversational LLM Agents in Data Analysis with On-the-Fly Code Visualization
Explore innovative techniques for monitoring and guiding LLM agents during data analysis through real-time code visualization and conversational steering methods.
Unifying Observability: Correlating Metrics, Traces, and Logs with Exemplars and OpenTelemetry
Discover how to correlate metrics, traces, and logs using OpenTelemetry SDK and Collector, enabling seamless navigation between observability signals for enhanced distributed system monitoring.
From Chaos to Calm - Building a Unified and Scalable CI/CD Pipeline
Discover how to build a unified CI/CD pipeline using cloud-native tools like Argo Rollouts and Backstage, improving development efficiency and reducing operational workload by 40% through streamlined workflows.
Shopify's Open Source Approach to Network Monitoring with eBPF, Vector and ClickHouse
Discover how to build a scalable network monitoring system using eBPF, Vector, and ClickHouse to process millions of events per second across Kubernetes clusters with real-world implementation insights.
Observability Data Volumes and Strategies for Managing System Growth
Explore strategies for managing growing observability data volumes, from historical growth patterns to current solutions and future possibilities in data processing and storage optimization.
Watching the Watchers: How We Do Continuous Reliability at Grafana Labs
Discover how Grafana Labs tackles production incidents, scales observability tools, and maintains reliability through real-world examples of monitoring challenges, failures, and successful solutions.
From Observability to Performance in Kubernetes - Metrics, Analysis, and Optimization
Discover how to optimize Kubernetes service performance through effective metrics collection, analysis, and bottleneck identification using tools like Prometheus, Grafana, and kube-burner for enhanced user experience.
Platform Performance Optimization for AI - A Resource Management Perspective
Discover practical techniques for optimizing AI platform performance through systematic resource management, from instrumentation and data gathering to visualization and throughput optimization.