
LeetCode Metrics App Using JavaScript - Complete Web Development Series 2024
Build a LeetCode metrics app with JavaScript in this comprehensive web development tutorial, covering key concepts and practical implementation for developers of all levels.
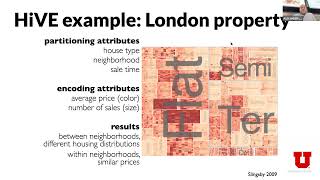
Visualization for Data Science - Creating Views and Dashboards
Master data visualization techniques for creating impactful views and dashboards, focusing on best practices for effective data presentation and communication in data science applications.
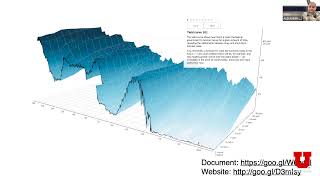
Visualization for Data Science: Working with Tabular Data - Lecture 1
Explore essential techniques for visualizing tabular data in data science, focusing on effective methods to represent and analyze structured information for meaningful insights.
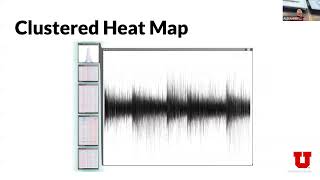
Visualization for Data Science: Working with Tabular Data - Part 2
Master effective visualization techniques for tabular data analysis, focusing on advanced methods to represent and interpret complex datasets for meaningful insights.
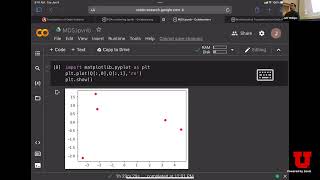
Dimensionality Reduction: Principal Component Analysis and Multidimensional Scaling - Lecture 21
Master dimensionality reduction techniques through Principal Component Analysis (PCA) and Multidimensional Scaling (MDS), exploring their applications in data analysis and visualization.
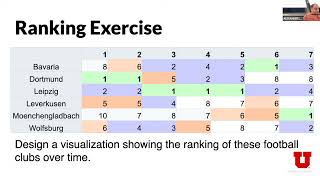
Visualization for Data Science - Creating Maps
Master geographic data visualization techniques and mapping principles for effective data science applications, focusing on creating impactful spatial representations and interactive visualizations.
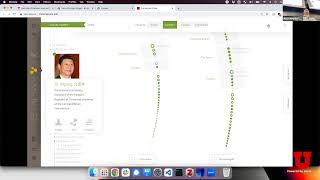
Visualization for Data Science: Network Analysis - Part 1
Master network visualization techniques and data science principles for effectively analyzing and presenting complex interconnected datasets and network structures.
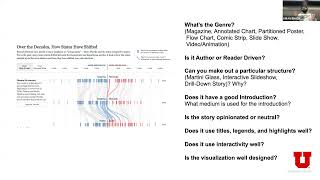
Visualization for Data Science - Storytelling
Master effective data visualization techniques for compelling storytelling, from choosing the right charts to crafting narratives that drive decision-making and engage audiences.
Visualization for Data Science - Filtering, Aggregation, and Clustering
Master data visualization techniques through filtering, aggregation, and interactive queries, exploring real-world applications like gerrymandering analysis and clustering methods including K-means and DBScan.
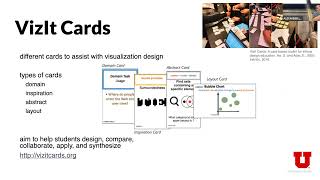
Visualization for Data Science: Design, Tasks, and Evaluation
Master data visualization principles through design fundamentals, task analysis, and evaluation methods for effective data science communication and insights.
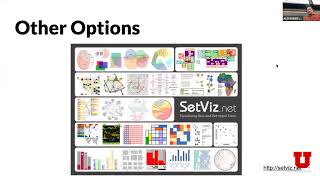
Visualization for Data Science: Evaluation, Sets, and Text Analysis
Explore advanced data visualization techniques for scientific analysis, focusing on evaluation methods, set theory applications, and text-based visualizations.
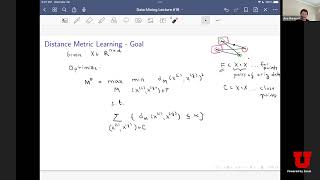
Multidimensional Scaling and Linear Discriminant Analysis in Data Mining - Spring 2023
Explore multidimensional scaling (MDS) and linear discriminant analysis (LDA), learning key concepts, motivations, and practical applications in data dimensionality reduction and classification.

Introduction to Tableau Data Visualization
Master data visualization fundamentals with Tableau, learning to create impactful charts, tables, and timelines that transform complex data into clear, actionable business insights.
Storytelling Through Data - Creating Impactful Insights Through Visualization and Analysis
Master the art of data-driven storytelling through structured approaches to analysis, visualization, and narrative creation. Learn to transform complex data into compelling, actionable insights that drive decision-making.
Uncovering Geologic Layers with Wolfram Language - Live Coding
Uncover geologic layers of South Asia using Wolfram Language. Import and analyze USGS shape data, explore geometry, and leverage Wolfram Knowledgebase for deeper insights into geological formations.
Getting Started with Interactive Reporting - Building Dashboards, Visualizations and Self-Service Apps
Create dynamic dashboards, visualizations, and self-service apps from scratch. Learn core features of Notebook Templating for better data insights and report generation in business intelligence.
What's New and Improved in Wolfram Language Version 14
Explore Wolfram Language 14's enhancements in AI, graphics, engineering, math, and more. Learn about LLM integration, data visualization, PDE models, and improved computational capabilities.
Explore the Total Solar Eclipse of 2024 with Wolfram Language
Predict and visualize the 2024 total solar eclipse using Wolfram Language. Calculate timings, create detailed sky and Earth maps, and understand the astro capabilities behind eclipse predictions.

Analyzing Real-World Networks in Wolfram Language
Explore graph theory techniques to extract insights from network data, uncover influential nodes, hidden communities, and vulnerabilities in social and infrastructure networks.
Visualizing and Computing Astronomical and Chemical Data and Historical Geography
Explore advancements in astronomical computation, 3D biomolecule representation, and historical geography using Wolfram Language 14.1's latest features and capabilities.
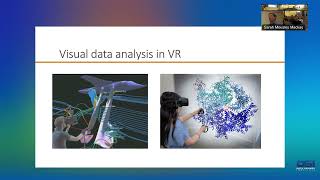
Quantifying the Benefits of Immersion in Virtual Reality
Explore the quantifiable benefits of VR immersion for real-world applications beyond gaming, backed by empirical studies and successful case studies in areas like scientific visual data analysis.