
Tame MTTR with Real-Time Anomaly Detection in Cloud-Native Systems
Master real-time anomaly detection techniques for Kubernetes clusters using statistical and ML algorithms to reduce MTTR, improve monitoring, and maintain optimal application performance.
NotePlayer - Engaging Jupyter Notebooks for Dynamic Presentation of Analytical Processes
Discover how to create dynamic presentations of analytical processes using Jupyter Notebooks with NotePlayer, enhancing data visualization and storytelling capabilities.
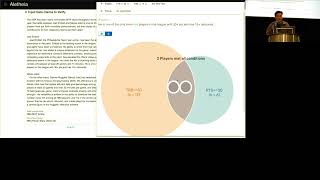
Towards Automated Fact-checking and Communication of Data Claims
Explore automated fact-checking systems and data claim verification methods to enhance the accuracy and credibility of information communication in digital environments.
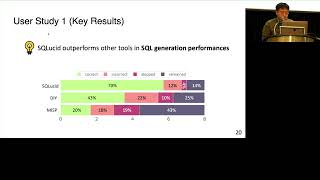
SQLucid - Grounding Natural Language Database Queries with Interactive Explanations
Explore interactive techniques for translating natural language queries into SQL, featuring novel approaches for database interaction and query explanation.
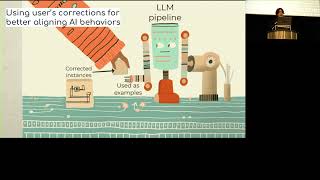
LLM-Powered Worldbuilding with Generative Dust and Magnet Visualization
Explore innovative LLM-powered visualization techniques for worldbuilding through an advanced combination of generative dust and magnetic field representations.
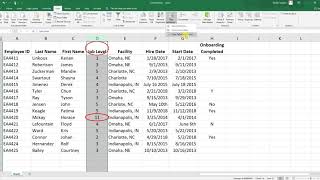
Excel Tutorials
Learn essential Excel techniques for HR data analysis, including data cleaning, statistical tests, and data visualization for effective decision-making.
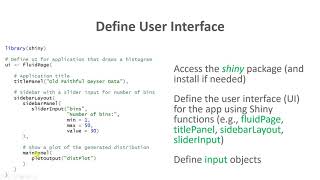
Data Visualization
Learn to create interactive web apps, tables, and various charts in R and Excel for effective data visualization and analysis.

Advanced Excel Techniques for HR Data Management and Analysis
Master advanced Excel techniques for HR data management, from pivot tables and conditional formatting to data validation and interactive reporting - all designed to streamline HR analytics and decision-making processes.
Mastering Conditional Formatting in Excel - Data Visualization and Analysis
Master Excel's conditional formatting features to enhance data visualization through highlight rules, data bars, color scales, and custom formulas for more impactful spreadsheet analysis and presentation.
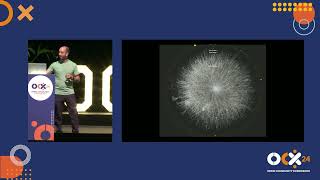
Insights and Lessons from Mapping the Open Source Science Landscape
Discover how mapping open source science ecosystems reveals interconnections, enhances tool discovery, and drives innovation through data-driven insights about projects, patents, funding, and collaboration networks.
Monitoring Raspberry Pi Servers with Telegraf, Influx, and Grafana
Master server monitoring with Telegraf, Influx, and Grafana to track Raspberry Pi performance metrics and create dynamic data visualizations for effective system management.

Excel for HR Professionals - Data Management and Analysis Fundamentals
Master essential Excel functions and tools specifically designed for HR tasks, from data organization and calculations to creating dynamic visualizations for workforce analytics and reporting.
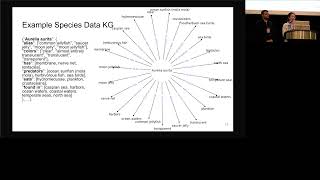
FathomGPT - A Natural Language Interface for Interactively Exploring Ocean Science Data
Explore an innovative natural language interface that revolutionizes ocean science data exploration and analysis through interactive visualization and AI-powered insights.
VIME - Visual Interactive Model Explorer for Identifying Capabilities and Limitations of Machine Learning
Explore an interactive visual tool for analyzing machine learning model capabilities and limitations through a systematic exploration interface.
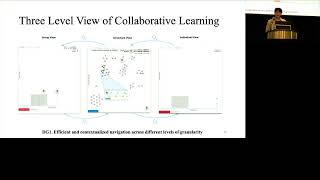
AI-assisted Event-driven System for Collaborative Programming Learning Analytics
Discover an AI-powered system for analyzing collaborative programming activities, featuring event-driven visualization tools to enhance learning assessment and group dynamics.
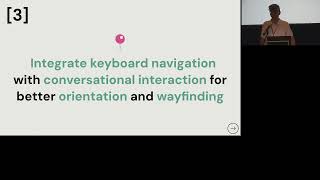
Enhancing Chart Accessibility with LLM-based Conversational Interaction
Explore innovative approaches to making charts more accessible through conversational AI and large language models, enhancing data visualization accessibility for all users.

ScriptViz - A Visualization Tool for Movie Script Analysis Using Database Insights
Explore an innovative visualization tool that enhances scriptwriting by leveraging comprehensive movie database analysis for more effective storytelling and narrative development.
Powering Sustainability with Open Source: The Energy Management Tech Stack
Discover how open-source tools can revolutionize energy management through real-time monitoring, data analysis, and building automation - enabling cost-effective sustainability solutions and improved energy efficiency.

3D Sholl Analysis Using Python for Neuron Branch Mapping
Learn to perform 3D Sholl analysis in Python by creating concentric spherical shells around soma centers and calculating neuron branch intersections for detailed morphological analysis.
Visualizing Complex Object Data Using Tree Structures in LabVIEW
Discover how to transform complex object data into clear, visual tree structures using JSON and SQLite, while learning to create custom LabVIEW controls for improved data management and visualization.

Data Models, PivotTables, and Power Query in Excel - Advanced Data Analysis Techniques
Master advanced Excel data analysis by combining PivotTables, data models, and Power Query to transform complex datasets into meaningful insights. Learn to create relationships, clean data, and generate powerful analytical reports.