
Building a Data Visualization App for Mobile Phones Using Python
Learn to create mobile data visualization apps using Python tools like NumPy and Matplotlib, without needing specialized mobile development skills.

Creative Coding with py5 - The Python Version of Processing
Explore py5, a Python framework for creative coding similar to Processing. Learn data visualization, art creation, and educational applications using familiar Python libraries.

Using Python to Assess Landslide Risk: A Matter of Life and Death
Exploring Python's role in analyzing river data to predict landslide risk in Southeast Alaska, showcasing its impact on community safety and anxiety reduction during heavy rainfall.

Making Beautiful, Publication Quality Tables in Python - 2024 Update
Explore techniques for creating visually appealing, publication-ready tables in Python, bridging the gap between raw DataFrame output and structured, informative displays.
The Metrics You Should Use but Probably Don't - Navigating Uncertainty in Knowledge Work
Explore innovative metrics for visualizing team reliability, predicting outcomes, and navigating uncertainty in knowledge work. Learn to articulate trade-offs and make data-driven decisions.
Ultimate PivotCharts Tutorial in Excel 365
Master Excel data visualization with PivotCharts and Map Charts. Learn creation, formatting, and practical application through hands-on exercises. Elevate your skills for clear, dynamic data representation.

How to Create Impactful Dashboards in Excel for Business Analytics
Learn to create dynamic Excel dashboards using pivot tables, charts, and advanced features. Master data cleaning, visualization, and analysis techniques for impactful business insights.

Advanced Streamlit for Python Developers
Deep dive into advanced Streamlit features for building robust, performant web apps in Python. Learn caching, session state management, and app testing through a multi-page GitHub activity dashboard with chatbot integration.

Visualize Data Like a Pro - Learn Tableau for Beginners
Learn to transform raw data into compelling visualizations with Tableau. Master the interface, data types, and dashboard creation for effective data-driven decision-making in just 35 minutes.
Creating and Delivering Effective Data-Driven Presentations
Master the art of data-driven presentations with strategies to clarify complex information, engage non-technical audiences, and create impactful visuals. Learn to avoid common pitfalls and enhance your storytelling skills for professional settings.

Building an Exciting Stock Market Twitter Sentiment App
Develop a Twitter sentiment analysis app for stock market insights using SingleStore AI. Learn to integrate APIs, process real-time data, and create interactive visualizations.
NJADAPT: New Tools and Critical Enhancements for Climate Change Planning
Explore powerful decision-support tools for climate change planning in New Jersey. Learn to assess hazards, visualize data, and apply insights to local planning and public health initiatives.
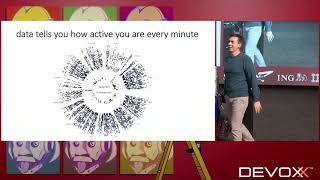
Use Your Data to Tell Stories
Interactive workshop on creating engaging data visualizations, exploring techniques and tools to reveal meaningful stories hidden in big data across various fields, from cancer diagnosis to zodiac signs.
50 Ways to Show Your Data
Explore advanced data visualization techniques using R's ggplot2 package. Learn to create compelling diagrams beyond basic plots, including waterfalls, violins, and maps, with minimal code effort.
Master Data Analytics with ChatGPT, Python and Excel
Learn data analytics essentials using ChatGPT, Python, and Excel. Covers data handling, regression modeling, summary statistics, and univariate analysis with practical examples on a car MPG dataset.
Strengthening Software Operations: Observability, Encryption, and SSO - Operator Day Insights
Strengthen software operations with predictive observability, certificate-based encryption, and simplified SSO. Learn to integrate tools, secure communications, and automate identity management for enhanced efficiency and security.

Complete DevOps Project: Deploy GoLang App with Kubernetes, ArgoCD, Prometheus and Grafana
Deploy a secure GoLang app with Kubernetes, ArgoCD, Prometheus & Grafana. Learn modern DevOps practices for automated, secure, and scalable deployment pipelines using various tools and technologies.
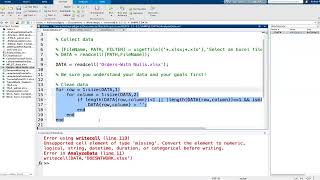
Data Cleaning with MATLAB - nanoHUB Tech Talk
Learn essential techniques for data cleaning in MATLAB, including handling missing values, removing outliers, and formatting data for analysis. Enhance your research and data processing skills.
Plotly Tips - Exploratory Data Analysis
Explore data visualization techniques using Plotly library for tips dataset analysis. Learn to create various chart types and gain insights through hands-on exploratory data analysis.

Unleash the Crypto Data Landscape - Hands-on Tutorial for Data Analysis and Visualization
Dive into hands-on crypto data analysis, building models and visualizations to extract meaningful insights and tackle real-world challenges in this interactive tutorial session.
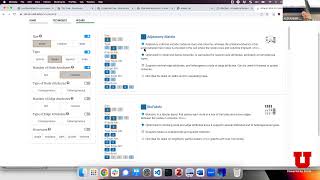
Visualization for Data Science: Network Analysis - Part 2
Explore advanced network visualization techniques and data science principles for creating effective visual representations of complex networked systems and relationships.