Visualize - Bringing Structure to Unstructured Data - MLOps Podcast #258
Explore techniques for structuring and visualizing unstructured data in machine learning, from classification to Retrieval-Augmented Generation, using tools like UMAP and Renumics Spotlight to uncover patterns and evaluate model performance.
EDA Techniques for Data Analysis
Explore powerful Exploratory Data Analysis techniques for cleaning, visualizing, and understanding datasets to drive insights and inform decision-making in business contexts.

Computer Science Graduate School Research and Programming Best Practices
Learn essential research and programming practices for computer science grad school, from version control to experiment organization and data visualization.
Understanding Allocator Impact on Runtime Performance in C++
Explore challenges in analyzing local memory allocators' performance impact on C++ runtime. Learn to choose tools, overcome instrumentation limitations, and design effective visualizations.
Mapping Brain Dynamics and Trajectories with Geometric and Topological Machine Learning
Explore geometric and topological machine learning techniques for mapping brain dynamics and trajectories, enhancing understanding of neural processes.
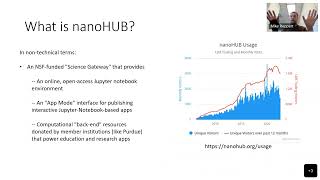
Hands-on Teaching with Jupyter Notebooks on nanoHUB
Explore hands-on teaching using Jupyter Notebooks on nanoHUB for chemistry courses. Learn to create interactive simulations, visualizations, and programming projects for enhanced student engagement and learning.
Building a Data Visualization App for Mobile Phones Using Python
Learn to create mobile data visualization apps using Python tools like NumPy and Matplotlib, without needing specialized mobile development skills.

Using Python to Assess Landslide Risk: A Matter of Life and Death
Exploring Python's role in analyzing landslide risk in Southeast Alaska, showcasing how data analysis can create a community-driven early warning system for potential disasters.

Creative Coding with py5 - The Python Version of Processing
Explore py5, a Python framework for creative coding similar to Processing. Learn data visualization, art creation, and educational applications using familiar Python libraries.
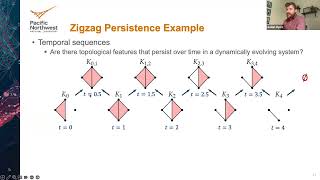
Understanding Temporal Hypergraph Dynamics with Zigzag Persistence
Explore temporal hypergraphs and zigzag persistence to analyze complex systems' topological evolution, applied to cybersecurity and social networks for understanding underlying dynamics.

Microsoft Word Copilot Tutorial - Streamlining Document Creation
Learn to leverage Word Copilot for efficient document creation, from drafting and rewriting to visualizing data and integrating with editing tools. Master AI-assisted writing to enhance productivity.

Become a Power Query Master in Excel in Less Than One Hour
Master Power Query in Excel: Learn to gather, clean, and transform data efficiently. Streamline your workflow, automate tasks, and optimize data preparation for analysis.
Pivot Bio's Spatial Analytics Evolution with Databricks and CARTO
Explore how Pivot Bio revolutionizes agricultural analytics using Databricks and CARTO, integrating diverse datasets for comprehensive farming insights and empowering spatial analysis in modern agriculture.
From Excel to Real-Time Insights Using Databricks, ThoughtSpot and Power BI
Transforme relatórios estáticos em insights em tempo real usando Databricks, ThoughtSpot e Power BI. Aprenda a construir uma plataforma de análise avançada para capacitar gerentes e analistas com dados atualizados.
How to Create a Holistic Customer View to Drive Performance and Revenue
Discover Graphite: a unified app for querying content lifecycle data, offering real-time insights into revenue streams using Databricks technologies and natural language querying for transformative data interaction.
Big Data Visualization in Public Health - Optimizing Respiratory Illness Dashboard with Databricks
Explore CDC's enhanced big data processing for public health visualizations, optimizing respiratory illness monitoring through efficient data management and accelerated insight delivery.
GenAI Platform for Democratizing Use and Maintaining Governance - Bradesco's Approach
Explore how Bradesco leveraged GenAI to revolutionize processes, enhance customer experiences, and achieve operational efficiency gains while maintaining governance and security through a lakehouse architecture.
Data Visualization Excellence: Tableau's Edge with Delta Sharing and Roadmap
Explore Tableau's innovations for Lakehouse analysis, including Delta Sharing connector and AI-driven insights. Learn about secure data visualization and future developments in this expert-led session.
Databricks SQL - Addressing Data Warehousing Challenges with Data Intelligence
Explore AI-powered data warehousing with Databricks SQL, addressing performance, governance, and usability challenges through intelligent data understanding and innovative features like natural language queries.
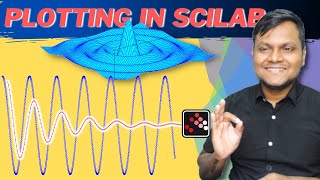
Plotting 2D and 3D Graphs in SCILAB - How to Plot Functions
Learn to create 2D, 3D, polar plots, and animations in Scilab. Master various visualization techniques for numerical computational tasks, enhancing your data representation skills.

Python and Data Storytelling - Avoiding Deaths by PowerPoint
Explore innovative Python tools and data storytelling techniques to create engaging, interactive presentations that captivate audiences and enhance information retention.