Visual Data Storytelling with Blender and Python
Create immersive 3D data visualizations by combining Blender's animation capabilities with Python's 2D plotting libraries for impactful storytelling and enhanced data interpretation.
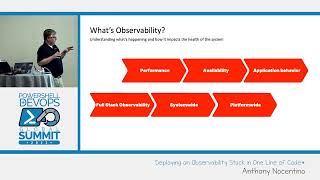
Deploying an Observability Stack in One Line of Code - PowerShell Summit 2023
Deploy an observability stack efficiently with a single line of code, enhancing system monitoring and troubleshooting capabilities for improved performance and reliability.
Re-interpreting Data - Turning Files into Audio, Images, and Music
Explore unconventional data transformations: hear JPEGs, visualize executables, and convert zip files to music. Learn to manipulate raw bytes and bits in Ruby.
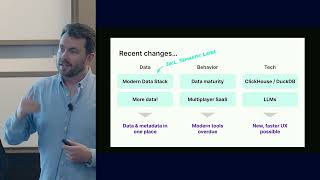
Latency is the Mind Killer - Reimagining Data Interactions
Explore innovative approaches to data interaction, focusing on visual, spatial, and fluid interfaces for faster decision-making. Learn about Hunch's journey in reimagining data engagement for analysts and business users.
Observing and Optimizing Drupal 8 Websites with OpenTelemetry, Monolog, and Grafana
Implement observability in Drupal using OpenTelemetry, Monolog, and Grafana to track complex requests, optimize performance, and troubleshoot distributed architectures effectively.
Improving User Experience with Drupal's Dashboard Initiative
Explore the Dashboard initiative's efforts to enhance Drupal's user experience by providing personalized, informative landing pages upon login.

Apache Spark Structured APIs Using Databricks
Master Apache Spark Structured APIs for data manipulation using Databricks. Learn RDD, DataFrame API, data aggregation, and ETL operations in this comprehensive overview.

Introduction to Looker and Google Analytics 4 (GA4) for Data Analytics and Reporting
Learn to create dashboards in Looker, analyze data, and leverage GA4 for enhanced website insights and reporting.

Angular AG Grid and Its Features with Pagination
Master Angular AG Grid's powerful features and pagination for enhanced data presentation and efficient management.

Using InfluxDB for Real-Time Monitoring in JMeter
Integrate InfluxDB with JMeter for real-time performance monitoring, capturing metrics and visualizing results with Grafana to gain proactive insights into application performance.
The Art of Effective Factory Data Visualization
Discover how to break data silos and leverage low-code visualization tools for effective factory data analysis, enhancing production processes and customer experiences.
Business Intelligence in the GenAI Era - What's New and What's Next
Explore the future of business intelligence with Google's Looker and learn how GenAI is revolutionizing analytics and discovery across industries.
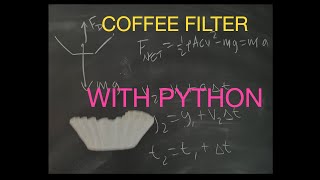
Very Simple Introduction to Numerical Calculations in Physics with Python
Learn to create numerical solutions in physics using Python, from basic coding to graphing and modifying code for practical applications.
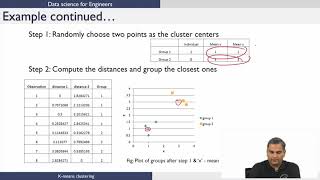
K-Means Clustering
Explore K-means clustering algorithm, its applications, and implementation techniques for effective data analysis and pattern recognition.
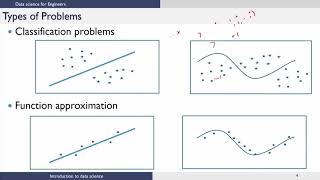
Introduction to Data Science
Explore fundamental concepts and applications of data science, gaining insights into its role in modern analytics and decision-making processes.
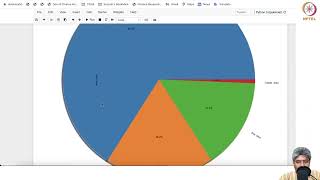
Hands-on Python: Analysis and Prediction of Bangalore House Price Data
Analyze and predict Bangalore house prices using Python, gaining practical data analysis skills for real estate market insights.

Getting Started with OpenSearch and OpenSearch Dashboards
Learn to set up and use OpenSearch for powerful search and analytics. Master cluster configuration, dashboard creation, and best practices for effective data visualization and management.
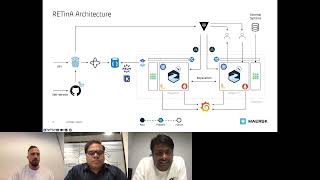
Transition to Apache Kafka on Kubernetes with Strimzi - A Migration Case Study
Explore Maersk's migration from Confluent to self-managed Apache Kafka on Kubernetes using Strimzi. Learn about architecture, implementation, monitoring, and self-service solutions for large-scale event streaming platforms.
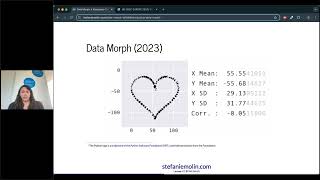
Data Morph: A Cautionary Tale of Summary Statistics
Explore Data Morph, an open-source tool challenging summary statistics assumptions. Learn to uncover hidden truths in datasets through innovative visualization techniques and reshape your approach to data analysis.
How to Build Interactive Spreadsheets in Excel
Enhance Excel spreadsheets with interactive form controls. Learn to create combo boxes, checkboxes, spin buttons, and option buttons for dynamic data entry, filtering, and visualization.
Building a Data Science Project in JavaScript
Build a data science project in JavaScript using Crawlee for web scraping and Apify for data processing. Learn to extract, analyze, and visualize insights from online sources.