Power BI and Azure Synapse Analytics - Creating a Unified Analytics Solution
Embark on a unified analytics journey using Power BI and Azure Synapse Analytics. Learn essential techniques to create powerful data solutions and gain valuable insights.
Azure Data Studio and the Surprises Inside
Discover hidden features and maximize your use of Azure Data Studio for enhanced database management and productivity.
Gathering Requirements for Your Star Schema
Collaboratively design dimensional models with business users for effective star schema requirements gathering and data visualization.

Azure Data Explorer: Introduction and Setup - The Last Crusade
Explore Azure Data Explorer setup and usage through practical examples in this introductory session on modern analytics and big data engineering.
Lessons Learned from Optimizing Enterprise Data Models
Discover tips and tricks for optimizing enterprise data models, reducing size, and meeting business needs when DirectQuery is the only option.
Real-Time Analytics in Microsoft Fabric - Unlocking Value from Streaming Data
Explore real-time analytics in aviation using Microsoft Fabric's Real-time Analytics. Learn data integration, visualization with Power BI, and swift decision-making techniques.
The Untruthful Art - Five Ways of Misrepresenting Data
Discover five common data misrepresentation techniques and learn to communicate complex information clearly and accurately in today's information-driven world.
Analytics Architectures on Microsoft Fabric
Explore diverse analytics architectures, their pros and cons, and how Microsoft Fabric supports their implementation for effective data analysis.
Common Data Science Mistakes and How to Avoid Them
Explore common statistical and data science pitfalls, learning to identify and avoid crucial errors in analysis and interpretation.
Microsoft Fabric Adoption: Measuring Success with KPIs - What Gets Measured, Gets Done
Implement specific measures and KPIs to track Microsoft Fabric and Power BI adoption, enhancing data-driven decision making and organizational performance.
Git off My Lawn - Mastering Power BI Deployments with Git Integration
Master efficient Power BI project management and deployment using Git integration. Learn techniques for streamlined workflows and version control in Power BI development.
Contextualizing Time Series Data with Graphs in Kusto
Explore Kusto's graph capabilities in Azure Data Explorer, learning to create and query graphs with intuitive syntax for enhanced time series analysis.
Exploratory vs Explanatory Dashboards - When to Build and How
Discover the key differences between exploratory and explanatory dashboards, and learn how to effectively design and implement each type for optimal data visualization.
Application Data Streaming with Apache Kafka and Swim
Explore real-time data streaming with Apache Kafka and Swim. Learn about stateful business logic, stream processing, and creating dynamic UIs for actionable insights from distributed data sources.
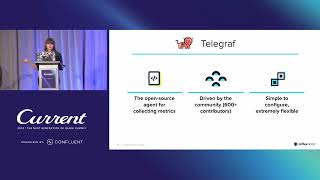
Maximizing Real-Time Data Processing with Apache Kafka and InfluxDB - A Comprehensive Guide
Learn to create powerful data pipelines by combining Apache Kafka and InfluxDB for real-time processing, analysis, and visualization of large-scale data, especially in IoT applications.
From Raw Data to an Interactive Data App in an Hour - Powered by Snowpark Python
Develop a Streamlit data app to visualize advertising ROI using Snowpark Python. Learn data ingestion, transformation, ML modeling, and interactive visualization techniques.
從零開始打造私有雲的 Kubernetes 監控 - 使用 Prometheus 和 Grafana
從零開始學習如何使用Prometheus和Grafana為私有雲Kubernetes建立監控系統,並了解常用CRDs以創建自定義監控報表。
Grafana 全家桶:打造高可用且具可擴充性的 O11y 平台
探索如何利用Grafana生態系打造高可用、可擴充的監控平台,涵蓋metrics、logging和tracing,並與常見解決方案比較優勢。
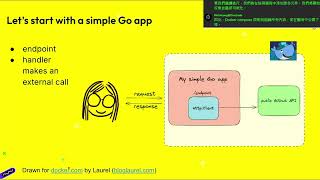
Getting Started with OpenTelemetry: Instrumenting, Collecting, and Visualizing Telemetry Data
Instrument, collect, and visualize telemetry data using OpenTelemetry in Golang applications. Learn strategies for effective implementation and data analysis.
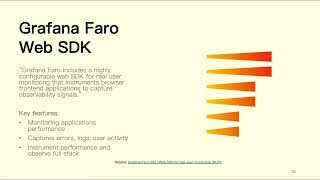
Grafana Alloy Best Practices: Multi-Tenant Design, Performance Optimization, and End-to-End Tracing
探索Grafana Alloy的多租户設計、性能優化和端到端追蹤,學習實施最佳實踐以提升監控和可觀察性能力。
Python and Data Storytelling to the Rescue: Avoiding Deaths by PowerPoint
Explore innovative Python tools and data storytelling techniques to create engaging, impactful presentations. Learn to combine interactivity and memorability for more effective communication.