The Next Phase - Information and Visualization with Digital Twins
Explore digital twins in IoT: benefits, standards, tech stacks, hardware, visualizations, and implementation strategies. Learn to plan, coordinate, and execute digital twin projects effectively.
Practical AI with Machine Learning for Observability in Netdata
Explore AI-driven observability in Netdata, comparing traditional monitoring with innovative approaches. Learn about distributed monitoring, anomaly detection, and future ML developments for enhanced system insights.
The Art of Data Storytelling Powered by Oracle Analytics
Explore data storytelling techniques using Oracle Analytics to create impactful narratives that influence decision-making and drive insights from complex information.
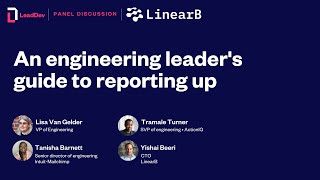
An Engineering Leader's Guide to Reporting Up
Gain strategies for confidently reporting to senior leadership and effectively showcasing engineering's impact within your organization.
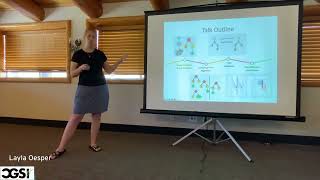
Tumor Evolution: Methods for Comparing, Summarizing and Visualizing Clonal Trees
Explore methods for comparing, summarizing, and visualizing clonal trees in tumor evolution, focusing on weighted distance-based approaches and relaxing infinite sites assumptions.
Modern Notebook Diffing in Wolfram Language
Explore new Wolfram Language diffing tools to compute and visualize changes between cells and notebooks, enhancing your understanding and workflow.

Exploring Historical Geology with Wolfram Language
Explore Earth's geological history using Wolfram Language tools like GeoGraphics, EntityValue, and Wolfram Function Repository for comprehensive historical geology analysis.
Beyond the Computational Essay - Evolving Notebooks into Robust Computational Systems
Explore techniques for transforming computational essays into robust, ongoing narratives and systems, overcoming common challenges in the process.
Unreal Engine and TouchDesigner Integration - Visualizing API Data in Immersive Experiences
Learn to visualize API data in Unreal Engine using TouchDesigner. Create interactive installations by processing weather data and translating it into visual content through OSC communication and blueprints.
Introduction to Data Visualization
Learn effective data visualization techniques to represent insights concisely, choose appropriate charts, and craft compelling data stories for impactful communication.
7 Steps to Creating a Visually Perfect Dashboard Every Time
Master the art of creating impactful dashboards. Learn a 7-step framework to design visually appealing, audience-focused data visualizations that effectively communicate insights and drive business decisions.
10 Data Science Uberhacks to Turbocharge Your Workflow
Discover 10 powerful data science techniques to dramatically boost productivity and efficiency in your workflow.
Adding Interactivity to Your Data Science Models - Getting Started with Streamlit
Learn to create interactive web apps for data science using Streamlit. Explore basic concepts, add widgets, interact with data, and deploy to the cloud. Build apps for visualization, model training, and analytics.
Top 4 Python Libraries for Data Science
Explore four essential Python libraries for data science: NumPy, Pandas, Matplotlib, and Seaborn. Learn their key benefits and practical applications in fundamental data science concepts.
Oh No! Not Another Data Grid! - Alternatives for Effective Data Visualization
Explore alternatives to data grids for effective data visualization. Learn to collaborate with users, identify antipatterns, and choose appropriate controls to enhance data analysis experiences.
Bridging Metrics with Humanity: Empowering Teams and Engaging Clients through Data Visualization
Explore data democratization strategies and storytelling techniques to empower teams and engage clients through effective data visualization, driving innovation and business impact.
Networks and Recommendation Systems
Explore graph-based recommendation systems, their transparent implementation, and real-world applications in this technical deep dive for data science practitioners.
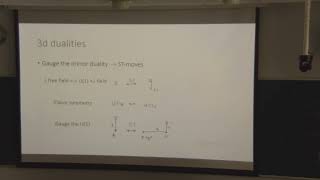
Quivers, 3D Gauge Theories and Three Manifolds
Explore connections between quivers, 3D gauge theories, and three-manifolds, uncovering relationships and equivalences in theoretical physics and geometry.
Functional Neuronal Networks
Explore functional data analysis integration in deep neural networks, enhancing interpretability and prediction for scalar responses with functional and scalar covariates.
Reproducible ML Experimentation with Rubicon-ML
Explore reproducible ML experimentation using rubicon-ml, an open-source Python library for capturing and storing model training information in a searchable way, ensuring full reproducibility and audit-ability.
Financial Client Churn Detection Using Computer Vision
Detect financial client churn using computer vision techniques. Convert historical client data into images and apply deep neural networks for predictive analysis.