
Marketing & Retail Analytics
Comprehensive tutorial on marketing analytics, covering RFM analysis, clustering, churn prediction, market basket analysis, and CLV modeling using tools like Tableau and KNIME.
Conditional Formatting in Excel - Excel Training - Excel Tutorial for Beginners
Learn to enhance Excel data visualization with conditional formatting, including color scales, data bars, and icon sets. Master techniques for highlighting cells based on specific conditions.
Jupyter Notebook Tutorial - How to Install Python Jupyter Notebook
Learn to install and use Jupyter Notebook for data science projects. Covers installation, key features, and a machine learning demo. Ideal for beginners and professionals looking to enhance their coding skills.
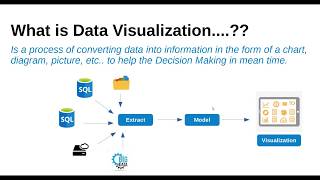
Data Visualization Tutorial
Learn essential data visualization concepts, explore BI tools, and master QlikSense for effective data transformation and dashboard creation.

Tableau Tutorial
Learn Tableau's key features, architecture, and data visualization techniques including charts, plots, and KPIs for effective business intelligence analysis.

Exploratory Data Analysis
Learn advanced techniques for exploratory data analysis and feature engineering in house price prediction, including automated visualization tools and efficient EDA libraries.
Data Analytics Tutorials
Learn essential data analytics skills through tutorials on statistics, Tableau, and Excel, covering key concepts and practical applications for beginners.
Statistics Tutorials Using Python
Learn essential statistical concepts and data visualization techniques using Python, covering descriptive and inferential statistics, distributions, and probability.
Best Practices With Pandas
Discover efficient data science techniques using pandas, covering tasks like group comparisons, handling missing values, and creating insightful plots with real-world datasets.
Data Analytics With R, Excel and Tableau Tutorials
Learn essential data analytics skills using R, Excel, and Tableau. Gain practical knowledge in business analytics and R programming to enhance your data-driven decision-making abilities.

Machine Learning
Comprehensive introduction to machine learning, covering algorithms, data analytics, and predictive modeling. Includes hands-on tutorials on data preparation, visualization, and decision tree implementation.

Data Analyst Portfolio Projects
Comprehensive guide to building a data analyst portfolio through hands-on projects in SQL, Tableau, Python, and Excel, covering data exploration, visualization, cleaning, and analysis.
Twitter API with Python
Learn to stream, analyze, and visualize Twitter data using Python. Master cursor pagination, data analysis techniques, and sentiment analysis for social media insights.
Python Tutorials for Beginners
Learn Python programming fundamentals through hands-on tutorials covering variables, data types, functions, and data visualization. Ideal for beginners looking to start a career in data science.
Daily Maths
Comprehensive coverage of essential O Level and IGCSE math topics, including unit conversion, ratios, pie charts, maps, percentages, and interest calculations.
Statistics O Level
Comprehensive guide to O Level Statistics, covering mean, mode, median, range, scatterplots, and correlation. Ideal for exam preparation and mastering key statistical concepts.
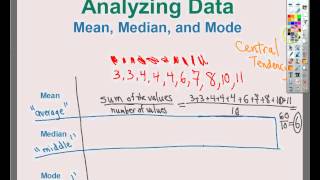
Data Analysis
Explore central tendency, data distribution, and statistical concepts using TI-84+ calculators. Learn about sampling methods and survey design for comprehensive data analysis skills.
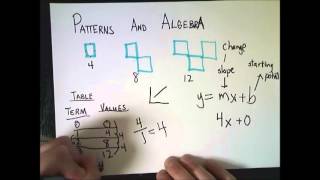
Algebra 2 Class Topics
Comprehensive review of Algebra 2 concepts, covering sequences, functions, graphing, inequalities, and matrices. Ideal for students seeking to strengthen their algebraic skills.
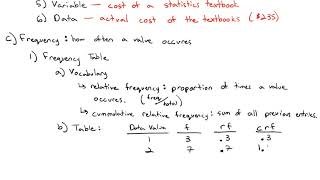
Exploring Introductory Statistics
Comprehensive introduction to statistics covering probability, distributions, hypothesis testing, and data analysis techniques for various scenarios.
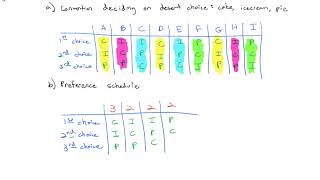
Math in Society
Explore voting systems, fair division, graph theory, growth models, financial math, statistics, and probability in this comprehensive applied mathematics course.
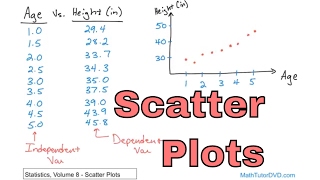
Statistics - Vol 8
Comprehensive exploration of statistical concepts including scatter plots, correlation, linear regression, and multiple regression, with practical Excel applications and in-depth analysis techniques.