
Python for Data Science - Data Science Tutorials for Beginners
Learn how to read data, process it, visualize and create reports. We also have our primary focus on Python to help you have your biggest leap into Data Science.
Data Science Full Course for Beginners - Python for Data Science
This video teaches Data Science and its key functions and concepts with a variety of demonstrations & examples to help you get started on the right foot.

Python Tutorial for Beginners - Learn Python
This video teaches Python and its key functions and concepts with a variety of demonstrations and examples to help you get started on the right foot.
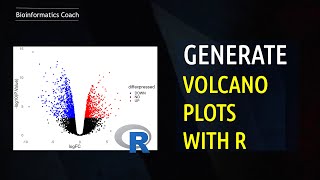
Data Visualization
Learn to create volcano plots and heatmaps in R for bioinformatics analysis. Reproduce Galaxy tutorials and master essential data visualization techniques for beginners.
Data Visualization in R
Learn to create impactful volcano plots and heatmaps for bioinformatics using R, with step-by-step guidance on reproducing Galaxy tutorials and utilizing the pheatmap package.
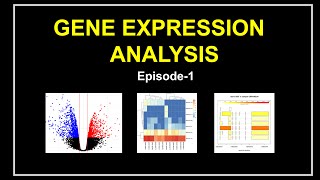
Gene Expression Analysis
Learn essential techniques for analyzing gene expression data, including RNA-Seq pipelines, volcano plots, heatmaps, and RNAseq data analysis using R and Python.
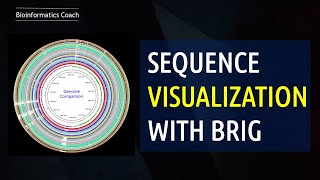
Genome Visualization
Explore genome visualization techniques using tools like BRIG, CGView, Artemis, and Python. Learn to create volcano plots, analyze pangenomes, and generate heatmaps for bioinformatics research.

Python for Beginners - Python Full Course - Python for Data Visualization
In this tutorial, we have covered all the important topics such as, What is Python, Data Manipulation with Numpy and Pandas, Data Visualization with Python, and much more, that will help you to get started with it.
Power BI Tutorial for Beginners - Visualization with Power BI
Great Learning brings you this video on “PowerBI Tutorial for Beginners” to help you set the right foot on starting out with Power BI. This video gives you a thorough insight into business intelligence, data visualization and data visualization tools.
Data Visualization Using Python in Seaborn
Learn to create statistical graphics in Python using Seaborn. Master line plots, bar plots, scatterplots, histograms, joint plots, and box plots for effective data visualization and analysis.

Matplotlib Python Tutorial
Learn data visualization with Matplotlib in Python. Master various plot types including line, bar, scatter, histogram, and pie charts to effectively represent and analyze data.

Deep Learning Full Course - Complete Deep Learning for Beginners
From Google’s Self Driving Car to Apple’s Siri, all of these are applications of Deep Learning. So, keeping in mind, the importance of deep learning, we have come up with this full course on ‘Deep Learning’.
Excel Tips and Tricks
Enhance Excel proficiency with time-saving tips and tricks for data analysis, visualization, and efficient spreadsheet management. Learn essential features to boost productivity.
Pivot Table in Excel
Learn to create, customize, and utilize Pivot Tables in Excel for efficient data summarization and analysis. Master various tools and techniques for powerful data insights.

Data Science with Python Full Course
Comprehensive introduction to data science, covering statistics, Python, machine learning, databases, exploratory analysis, visualization, deep learning, and neural networks with practical examples.
Python for Analytics - Numpy, Pandas, Matplotlib, Seaborn
Comprehensive guide to Python analytics libraries: Numpy, Pandas, Matplotlib, and Seaborn. Includes hands-on projects, interview prep, and practical applications for data analysis and visualization.
Deep Learning Tutorial with Python
Comprehensive tutorial on deep learning with Python, covering essential libraries, machine learning concepts, neural networks, and computer vision with practical demonstrations and examples.
Beginner's Guide to Microsoft PowerPoint
Comprehensive guide to Microsoft PowerPoint, covering basics to advanced features. Learn to create engaging presentations with animations, SmartArt, charts, and data visualization techniques.
Machine Learning with Python for Beginners
Learn Python libraries, machine learning concepts, regression techniques, Naive Bayes, and deep learning fundamentals. Gain practical skills through demonstrations and examples to kickstart your machine learning journey.
Big Data Analytics for Beginners
Comprehensive introduction to big data analytics, covering key concepts like Hadoop, Apache Spark, and ETL. Ideal for beginners seeking to understand the landscape and value chain of big data.
Data Visualization with Tableau
Learn to create interactive visualizations and dashboards using Tableau. Master data interpretation, business intelligence concepts, and various visualization techniques for effective data-driven decision-making.