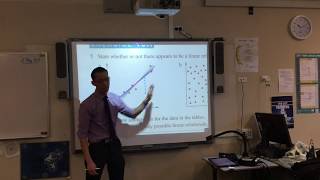
Bivariate Data Analysis
Explore scatter plots, correlation coefficients, and lines of best fit to analyze relationships between two variables in this comprehensive introduction to bivariate data analysis.
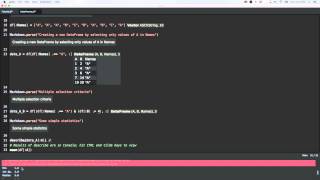
The Julia Computer Language
Learn Julia programming language fundamentals, data structures, control flow, functions, and data visualization with Gadfly. Practical medical statistics project included.

Julia
Learn Julia programming for data analysis, statistics, and linear algebra. Covers databases, plotting, environments, and advanced mathematical concepts with practical tutorials.

Data Viz Using Plotly for R
Learn to create interactive data visualizations with Plotly in R, covering various chart types and customization techniques for effective data presentation.
R Tutorials
Learn essential R skills for data analysis, visualization, and machine learning, covering statistics, deep learning, Plotly, and real-world applications like COVID-19 data extraction.
Working with StatCrunch
Learn to use StatCrunch for data analysis: importing, visualizing, and analyzing data with various statistical methods. Master creating charts, performing tests, and exporting results efficiently.

Excel Skills
Enhance data analysis skills with time-series plots, matrix-to-vector conversion, vlookup, histograms, text data import, and correlation techniques in Excel.
Biostatistics
Explore advanced biostatistics techniques, from ANOVA to experimental design, enhancing your ability to analyze scientific data and interpret research papers effectively.

GCSE Maths Revision - Statistics and Probability
Comprehensive statistics and probability revision covering key topics for GCSE exams, including averages, probability trees, charts, and data representation methods.
Introduction to Business Analytics
Comprehensive introduction to business analytics covering data manipulation, statistical concepts, visualizations, and analytical techniques for informed decision-making in business contexts.
Data Visualization
Learn Tableau for data visualization, covering introduction, aggregation, and table calculations in a comprehensive video series.

R Programming Crash Course
Comprehensive introduction to R programming, covering installation, data types, data manipulation with dplyr, visualization with ggplot2, and practical data analysis techniques for beginners.

Excel 2016 Tips, Tricks, Shortcuts, Functions & Formulas
Master Excel 2016 with 30 essential tips, tricks, shortcuts, functions, and formulas. Boost productivity and efficiency in data management, analysis, and visualization.
Build a Covid Tracker App With Vue.js & Tailwind
Learn to build a Vue.js and Tailwind-based COVID-19 tracker app. Covers setup, data fetching, component creation, and country-specific data handling in this hands-on tutorial.
Tools to Monitor Azure Cost - Hello World
Explore Azure Cost Management features: budgets, cost analysis, exports, and Power BI integration. Learn to monitor, analyze, and optimize your Azure spending effectively.

Google Sheets Tutorial - Designed for Beginners
Comprehensive beginner's guide to Google Sheets, covering layout, formatting, functions, charts, sharing, and protection. Learn essential skills for efficient spreadsheet management and data analysis.
Istio Setup in Kubernetes - Step by Step Guide to Install Istio Service Mesh
Step-by-step guide to install and configure Istio Service Mesh on Kubernetes, covering setup, deployment, proxy injection, monitoring, and management using Kiali.
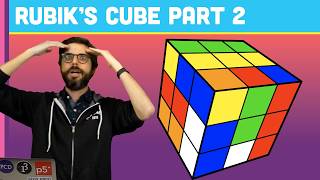
Rubik's Cube Part 2
Simulate Rubik's Cube face rotations using matrix operations and refactor code with a separate Face class, building on previous concepts to create a more advanced 3D puzzle simulation.
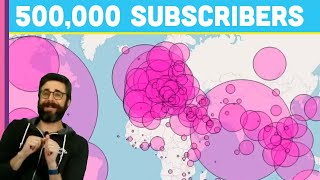
Visualizing 500,000 Subscribers
Create an interactive world map visualization of subscriber locations using Mappa.js, celebrating 500,000 YouTube subscribers with data parsing, overlays, and dynamic resizing based on zoom levels.

Double Pendulum
Simulate a double pendulum in Processing (Java) with step-by-step guidance. Learn to implement formulas, visualize motion, and add path tracing and damping effects.
More Inverse Kinematics and Texturing Cloth Simulation
Explore advanced inverse kinematics techniques and learn to texture 3D cloth simulations in Processing. Gain hands-on experience with multiple snake models, fixed points, and meshed cloth texturing.