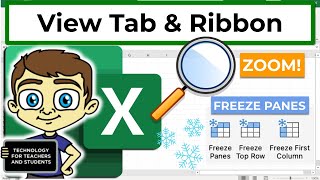
Excel View Tab and Ribbon in Depth
Explore Excel's View tab features like zoom, freeze panes, and Page Break Preview to enhance productivity and streamline your workflow in this comprehensive tutorial.
Build a Python Website in 15 Minutes with Streamlit
Learn to create interactive Python websites rapidly using Streamlit. Build data dashboards and user interfaces effortlessly in this hands-on tutorial for beginners and experienced developers alike.
Excel 365 for Beginners - Streamline Your Data with Correct Number Format - Part 27
Learn to enhance data readability in Excel 365 by mastering Number Formatting. Explore various formats like currency, dates, and percentages using the Number group on the Home Ribbon.
Excel 365 for Beginners: Table Creation and Style Customization - Part 35
Learn to convert data into Excel tables, customize styles, rename tables, and efficiently format columns in this tutorial on table creation and customization in Excel 365.
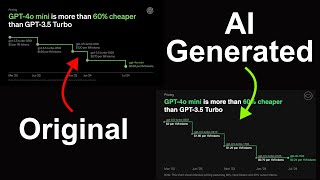
Recreating Charts with AI: GPT-4o mini and Claude 3.5 Sonnet Workflow
Learn to recreate charts using AI models GPT-4o mini and Claude 3.5 Sonnet in this concise AI workflow tutorial, enhancing your data visualization skills.

Sholl Analysis - Aggregating Profiles from Multiple Soma
Aprenda a realizar análise de Sholl em múltiplos neurônios, combinando perfis de diferentes tamanhos através de interpolação para comparação e cálculo de médias significativas.

Sholl Analysis Using Python - Quantifying Neuronal Branching Patterns
Learn to perform Sholl analysis on neuronal images using Python, quantifying branching complexity and comparing neuronal structures across different conditions or cell types.

Visualizing Data for Digital Twins in UE5 - Complex Data Insights and Communication
Explore data visualization for digital twins using Unreal Engine. Learn to create complex insights, bridge communication gaps, and tackle large-scale problems with visual-first solutions.
Turn Data into Business Assets with Embedded GenAI-Powered Analytics
Explore how embedded GenAI-powered analytics and natural language search can revolutionize self-service analytics, accelerate insights, and create new revenue streams for businesses.
Petabyte-Scale Data Management with Mercedes, Databricks SQL and Plotly Resampler
Efficient solution for managing petabytes of data using serverless SQL warehouses, combining Mercedes' tech with Databricks Platform and Plotly Resampler for high-performance analytics and real-time insights.
LLM-Powered BI: Turn Unstructured Data into Actionable Insights
Discover how The Jordan Company modernized its business with AI and Databricks, enabling self-service data analysis and automating tasks like term sheet summarizations for improved capital markets decision-making.

Streaming Cross-Sectional Data Visualization with Perspective and Spark
Explore real-time data visualization using Perspective and Spark Streaming. Learn to build high-performance, interactive applications for analyzing streaming data in various industries.
Power S&P Capital IQ Data Apps with Databricks and Plotly
Explore S&P Capital IQ Data Apps: Leveraging Databricks and Plotly for powerful analytics, data processing, and interactive visualizations using S&P Global's extensive financial datasets.
ChatGPT Vision Tutorial: 14+ Examples and Use Cases
Explore ChatGPT's groundbreaking vision capabilities, from generating code to analyzing medical images. Learn how this AI revolutionizes image understanding across various fields.
Sciphi Triplex: A Cost-Effective Alternative to Microsoft GraphRAG
Explore Sciphi Triplex: a cost-effective, high-performance alternative to Microsoft's Graph RAG for creating knowledge graphs from unstructured data. Learn setup, implementation, and visualization techniques.

Visual Data Storytelling with Blender and Python
Discover how to create immersive 3D animations for data storytelling by combining Blender's 3D capabilities with Python's 2D plotting libraries, enhancing your data visualization skills.

Seeing is Believing - Using Diagrams to Communicate Complex Ideas with Python
Explore techniques for creating effective diagrams and visuals to simplify complex ideas in Python projects, enhancing team communication and documentation.
KubeVirt Observability with Prometheus and Grafana
Explore KubeVirt observability using Prometheus and Grafana for enhanced monitoring and visualization of virtualized workloads in Kubernetes environments.

The Untruthful Art - Five Ways of Misrepresenting Data
Explores five ways data can be misrepresented, revealing hidden trickery in visual communication. Learn to spot deceptive practices and communicate information honestly and effectively.
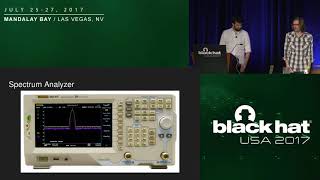
What's on the Wireless - Automating RF Signal Identification
Explore automated RF signal identification techniques for monitoring diverse wireless technologies in organizational environments, enhancing security and management capabilities.

Monte Carlo Pi Methods: Technical Editing - Lecture ME3256
Enhance technical writing skills for Monte Carlo pi methods. Learn effective editing techniques to improve clarity and precision in scientific reports.