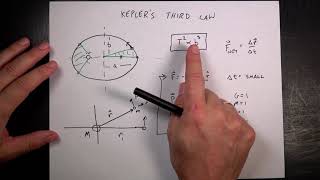
Demonstration of Kepler's Third Law Using Python
Explore Kepler's Third Law through Python modeling, calculating orbital periods and semi-major axes for various orbits to verify the law's validity.
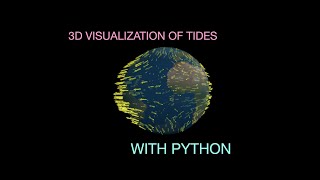
Visualizing Tides in 3D with Python
Explore 3D tide modeling using Python, combining calculation and visualization techniques for a comprehensive understanding of tidal patterns.
Three Ways to Make Animated Graphs in Python
Learn three simple techniques for creating animated graphs in Python using matplotlib and vpython, from basic to advanced methods.
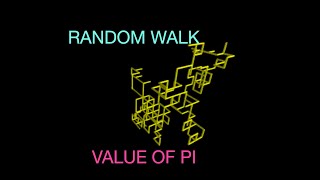
Finding the Value of Pi from a Random Walk Using Python
Explore Python coding to calculate pi using random walks, from 1D to 3D simulations. Enhance mathematical understanding through practical programming.
SpatialDependence.jl: Exploratory Spatial Data Analysis - JuliaCon 2024
Explore spatial data analysis with SpatialDependence.jl. Create spatial weights matrices, calculate lags, test autocorrelation, and plot choropleth maps using polygon and point geometries.

React for Big World Data - The Making of Shopify's BFCM Globe - RUC 2024
Explore real-time data visualization using React, focusing on Shopify's BFCM globe. Learn architectural design, 3D rendering, and performance optimization for dynamic, multi-platform experiences.
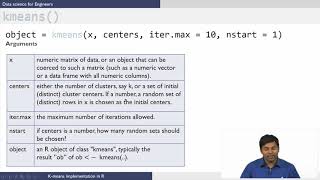
K-Means Implementation in R
Implement K-means clustering algorithm in R programming language. Learn data preprocessing, algorithm application, and result interpretation for effective data analysis.
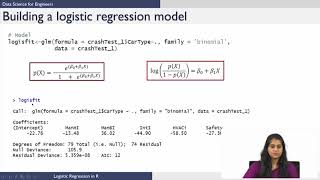
Logistic Regression Implementation in R for Automotive Crash Testing
Implement logistic regression in R for automotive crash testing, from data preparation to model evaluation and prediction.
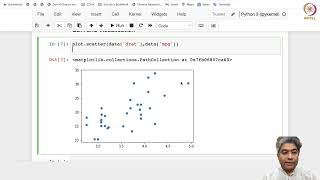
Hands-on with Python: Estimating Regression Coefficients with OLS and Abline - Part 2
Estimate regression coefficients using OLS and abline in Python, gaining practical experience with statistical analysis techniques.

Three Tips for Better Visual Presentations
Discover three powerful guidelines for enhancing collaboration through effective visualization of ideas, based on extensive research and practical insights.
A Journey in Geospatial Timeseries - Handling Marine Traffic Data with PostgreSQL
Explore PostgreSQL's geospatial capabilities for handling timeseries data in marine traffic, using JSON types, PostGIS, and TimescaleDB extensions.
Latency Monitoring Metrics: Why Average Is Not a Good Measure
Explore why average latency metrics are inadequate. Learn about max latency, true impact, and latency distributions for comprehensive monitoring and analysis of system performance.
Building Your First AI Agent Project with OpenAI - Lecture 1
Explore building an AI agent project using OpenAI-o1, covering agent flowcharts, code implementation, and execution of OpenAI-o1 agents in just 20 minutes.
MLOps LLM Stack Hackathon Winner - Visualizing MLOps Community Trends
Explore MLOps community trends through interactive tools visualizing Slack message content, presented by open-source contributor and LangChainGo maintainer Travis Cline.
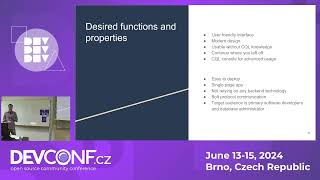
CypherGUI - Simplifying Graph Database Administration
Simplify graph database management with CypherGUI, an open-source app offering intuitive interface and powerful features for users of all skill levels.
Crafting and Leveraging Prometheus Metrics for Infrastructure Intelligence
Explore Prometheus metrics for data-driven infrastructure decisions. Learn query-building, tools, and data warehouse concepts to maximize insights from your system's metrics.
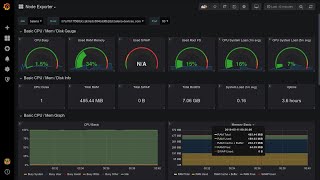
Installing and Configuring Prometheus - A Comprehensive Guide
Install, configure, and leverage Prometheus for effective system monitoring. Master data collection, querying, visualization, and alerting to gain valuable insights into your applications and infrastructure.
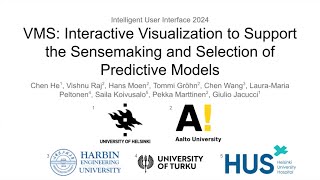
VMS: Interactive Visualization to Support the Sensemaking and Selection of Predictive Models
Explore interactive visualization for comparing and selecting predictive models, integrating performance, instance, and feature-level analysis to support informed decision-making in machine learning.
Creating PivotTables and PivotCharts Dashboards with Slicers in Excel
Learn to create interactive Excel dashboards using PivotTables, PivotCharts, and Slicers. Master data visualization techniques, customize slicer appearance, and integrate timeline slicers for date-based filtering.
Rasters.jl - Raster Data and GIS Tools for Julia
Explore Rasters.jl for Julia: handle raster data, GIS tools, and large datasets with ease. Efficient spatial operations, plotting, and ecosystem compatibility for geospatial analysis.
MATLAB to Julia: Practical Examples for MATLAB Developers
Explore practical examples of transitioning from MATLAB to Julia, covering plotting, file handling, control systems, and package development for experienced MATLAB users.