End-to-End Data Engineering on Azure Spark Cluster: Japan Visa Analysis
Set up Spark master-worker architecture in Docker on Azure, process and visualize Japan visa data using PySpark and Plotly. Clean, transform, and gain insights into visa trends through interactive data analysis.

One Dataset and Three Use Cases with Microsoft Fabric
Leverage World Bank Open Data with Microsoft Fabric using various methods, model data, and create stunning reports in this demo-filled session on end-to-end solutions.
Accelerate Insights with Natural Language-Driven Analytics in BigQuery
Explore BigQuery's new natural language-driven analytics experience for faster data-to-insights journey across discovery, processing, querying, and visualization.
Data Storytelling and Visualization
Learn effective techniques for communicating data-driven concepts through storytelling and visualization, applicable to both expert and non-expert audiences.

Log Aggregation
Explore real-time log aggregation with Humio for efficient system monitoring. Learn about its unique features, query language, and advantages over alternatives for critical distributed systems.
How Graph Data Science Can Turbocharge Your Knowledge Graph
Explore how Graph Data Science enhances Knowledge Graphs, offering powerful insights through centrality algorithms and node embeddings. Learn applications in drug discovery and get started with Neo4j.
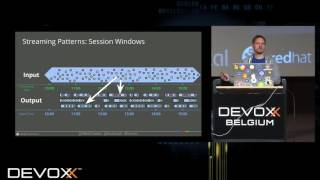
Google Dataflow - The New Open Model for Batch and Stream Processing
Explore Google Dataflow's unified batch and stream processing model through real-time demonstrations, practical insights, and visualization techniques for managing data streams.
Crash Course in Kubernetes Monitoring
Learn to instrument applications, gather metrics, and act on aggregate data for effective Kubernetes monitoring using Prometheus and Grafana in cloud-native environments.
Creating a Dynamic Pie Chart Effect Using Lightwave 3D and Adobe After Effects - Day 1
Learn to create dynamic pie charts using Lightwave 3D and After Effects. Master modeling, slicing, radial arrays, morph maps, lighting, UI design, and expressions for interactive data visualization.
Create an Interactive Animated Bar Graph with Cinema 4D and Xpresso - 2
Learn to create dynamic 3D bar graphs using Cinema 4D's Xpresso and Mograph, automating value-based changes for efficient data visualization in just 34 minutes.
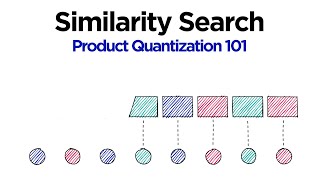
Product Quantization for Vector Similarity Search - Python
Learn to compress high-dimensional vectors using product quantization, reducing memory usage by 97% and improving search speeds by 92x. Includes Python implementation and visualization techniques.
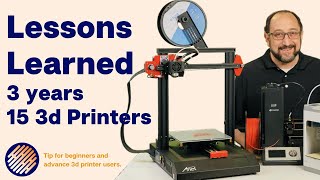
3D Printing Tips for Beginners and Experts
Comprehensive guide covering essential 3D printing topics, from printer types and filament selection to calibration and maintenance. Ideal for beginners and experienced users seeking practical tips and insights.

Two Dual Material IDEX 3D Printers Compared
Comprehensive comparison of two IDEX 3D printers, exploring their features, operating modes, calibration, and print quality. Ideal for makers seeking insights into dual-material printing technology.

Using an Arduino with Python - Live Thermometer 3D Visual Using DHT11
Learn to create a live 3D thermometer visualization using Arduino, DHT11 sensor, and Python. Combine hardware interfacing with data visualization for real-time temperature and humidity monitoring.

Using an Arduino with Python - Passing Data From Arduino to Python
Learn to transmit data from Arduino to Python, enabling stunning 3D model animations. Explore Arduino code, Visual Studio setup, and serial communication techniques for interactive projects.

Making Beautiful, Publication Quality Tables in Python - 2024 Update
Explore techniques for creating visually appealing, publication-ready tables in Python, bridging the gap between raw DataFrame output and structured, informative displays.
Having Fun with Python: Originating and Processing Data for Innovative Visualization and Analytics
Extract and process data with Python to answer quirky questions and create innovative visualizations for data-driven insights.
Using Data Science to Support Mental Health
Explore how data science analyzes mental health platform usage to understand UK mental health trends and connect people with local services.
Power BI and Azure Synapse Analytics: Beginning Your Journey
Explore Power BI and Azure Synapse Analytics integration, learning effective data leveraging techniques to maximize insights and optimize your data strategy.

Troubleshooting Unstructured Data with Embeddings
Explore embedding techniques for troubleshooting unstructured data models, gaining insights into internal representations and improving ML workflows.

OpenTelemetry Tracing for .NET Developers
Explore OpenTelemetry tracing principles and implementation in .NET for distributed systems. Learn to trace workflows, identify bottlenecks, and export data to popular visualization backends.