Using an Arduino with Python - Measuring Temperature and Humidity With the DHT11
Learn to measure temperature and humidity using Arduino and Python with the DHT11 sensor. Includes wiring, coding, and data visualization techniques for practical IoT applications.
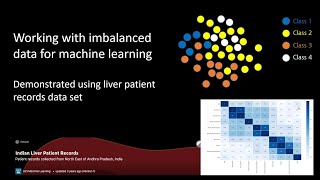
Working With Imbalanced Data for ML - Demonstrated Using Liver Disease Data
Learn techniques for handling imbalanced datasets in machine learning, demonstrated using liver disease data. Covers data up-scaling, SMOTE, and ROCAUC evaluation to improve model accuracy.

How to Create an Editable Pie Chart in Adobe Illustrator
Master editable pie charts in Adobe Illustrator: create, stylize, and customize with the Pie Graph Tool, Direct Selection Tool, and Appearance panel. Learn to add legends and backgrounds for professional infographics.
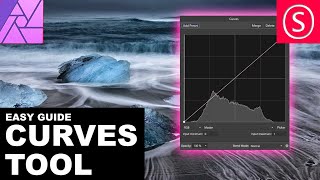
Curves Adjustment Explained - Affinity Photo Beginners Tutorial
Comprehensive tutorial on using Curves in Affinity Photo, covering histogram, channels, tonal range, and blend modes with practical examples for photo adjustment and creative effects.

The Beauty of Data Visualization
Explore how complex data sets can be transformed into visually appealing diagrams, revealing hidden patterns and connections while simplifying information overload.
Demystifying AI and Machine Learning to Enhance SOC Detection
Demystifies AI and machine learning for SOC teams, focusing on practical applications like data leak prevention. Includes live demo and insights from Credit Agricole's SOC experience.

The Biggest Risks Facing Cities and Some Solutions
Explore urban fragility through interactive maps and discover six principles for building resilient cities. Learn how cities can be the foundation for political life and an antidote to reactionary nationalism.
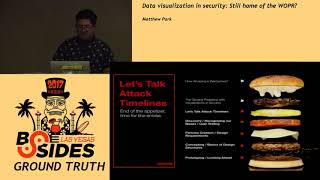
Data Visualization in Security - Still Home of the WOPR?
Explore data visualization in cybersecurity, from WOPR to modern techniques. Learn about user-centric design, research phases, and prototyping for effective security data representation.
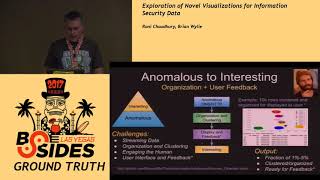
Exploration of Novel Visualizations for Information Security Data
Explore innovative data visualization techniques for information security, covering ELQ Stack, organic visualization, machine learning, anomaly detection, and similarity engines.

New Video Technology That Reveals an Object's Hidden Properties
Groundbreaking video technology detects subtle vibrations to recreate sound from seemingly still objects, enabling interactive exploration of hidden properties through simple video analysis.

Artfully Visualizing Our Humanity
Explore how artist Aaron Koblin transforms vast data sets and crowd-sourced contributions into stunning visual art, revealing new perspectives on human connectivity and modern technology.

Architecture That Senses and Responds
Explore innovative urban design using data visualization and interactive environments. Learn how passive data sets can create surprising insights into city life and inspire responsive architecture.

PyramidScheme.jl Overviews for Larger Than Memory Arrays
Explore efficient computation and interactive plotting of Pyramids for large arrays using PyramidScheme.jl, DiskArrays.jl, and Makie.jl ecosystem in Julia programming language.
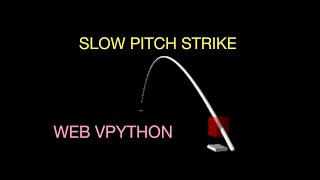
Modeling a Slow Baseball Pitch
Explore the physics behind slow baseball pitches using Python programs, analyzing their trajectory and impact on gameplay.

How Dashboards as Code Can Help You Develop and Validate Your Analytics
Explore DataOps practices for efficient dashboard development. Learn code-based approaches to streamline BI processes, improve accuracy, and enhance the analytics lifecycle at Glean.
A Vision for a Web of Net-Zero Data
Explore a visionary approach to creating interconnected net-zero data systems, revolutionizing sustainability efforts and environmental impact tracking.

How to Search Your Twitter Archive with Python
Learn to download, reshape, order, and analyze your Twitter archive using Python, enabling you to find and preserve your best tweets during uncertain times.
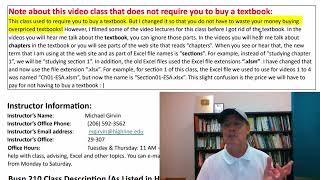
Excel Statistical Analysis - Introduction
Explore Excel's statistical analysis tools for business applications in this comprehensive introduction to Highline College's Busn 210 course.

ME3255 - Analyzing NYSE Monte Carlo Model
Analyze NYSE stock data using Monte Carlo simulations. Learn to model market behavior and predict future trends with statistical methods.

React for Big World Data - The Making of Shopify's BFCM Globe - RUC 2024
Explore real-time data visualization using React, focusing on Shopify's BFCM globe. Learn architectural design, 3D rendering, and performance optimization for dynamic, multi-platform experiences.

Online Diagramming Tools for Software Development
Discover essential online diagramming tools and their practical applications for various development and documentation needs, with expert recommendations and use-case scenarios.