Analyzing 33 Million Bike Trips with BigQuery
Explore NYC bike share trends using BigQuery to analyze 33 million trips. Learn to query, visualize, and interpret data for insights on popular routes and rider demographics.

Visualisation
Explore innovative visualization techniques for project management, moving beyond traditional methods to enhance information sharing and team collaboration.
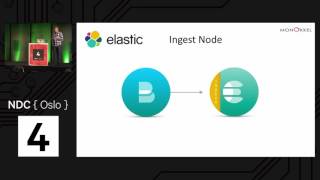
Data Magic with the Elastic Stack
Explore key features of Elastic 5.x suite for data analytics, including geo-capabilities, pipeline aggregations, and Timelion, with real-world cases and Kibana visualization demonstrations.
Using EEG and Machine Learning to Perform Lie Detection
Explore lie detection using EEG and machine learning. Learn about data collection, Azure ML model building, and result analysis. Gain insights into brain-computer interfaces and their potential applications.

Take Control of the Data of You
Discover how to leverage personal data for actionable insights, using Azure Machine Learning and Cosmos DB to create a digital assistant for health monitoring and habit formation.
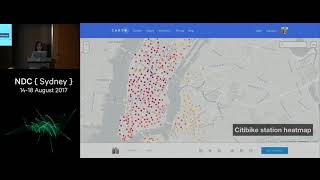
Analyzing 33 Million Bike Trips with BigQuery
Explore NYC bike share trends using BigQuery to analyze 33 million trips. Learn to query and visualize big data, with applications for various datasets including Australian and Github data.
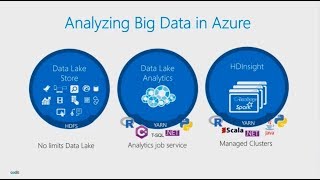
Analyzing StackExchange with Azure Data Lake
Explore big data analysis using Azure Data Lake to gain insights from StackExchange data dumps. Learn to leverage SQL and C# skills for efficient data processing and visualization with Power BI.
Who Needs Dashboards
Explore various dashboard types, their importance, and how to tailor them to different roles and needs within a company for maximum insight and effectiveness.

Designing for Trust
Explore key principles for building user trust through UX design, featuring a case study on leveraging data visualization, user research, and content strategy best practices.
A Practical Guide to Graph Databases
Explore graph databases' practical applications, use cases, and patterns. Learn to leverage their power for solving real-world business problems and gaining valuable insights.
The Future of Data Visualization on the Web
Explore modern data visualization techniques and future trends for web-based charts and graphs, moving beyond static images and HTML table tricks.
Creating & Maintaining Impactful Dashboards
Explore techniques for creating effective, audience-tailored dashboards. Learn to design concise yet informative visualizations, identify useful patterns, and maintain relevance for monitoring software and projects.
A Practical Guide to Dashboarding
Explore dashboarding essentials: from choosing tools to extracting metrics via telemetry. Learn setup techniques, best practices, and common patterns for creating impactful visualizations that drive informed decision-making.
A Practical Guide to Dashboarding
Comprehensive guide to creating effective dashboards: from choosing tools and metrics to setting up monitoring infrastructure and avoiding common pitfalls. Practical demo included.
Logging, Metrics and Events in ASP NET Core
Explore effective application monitoring in ASP.NET Core, covering logging, metrics, and events. Learn to implement visibility tools and gain actionable insights for distributed systems.
Lightning Talks
Explore data storytelling, non-relational database design, Blockchain-AI correlation, and open-source software trust in four concise lightning talks by industry experts.
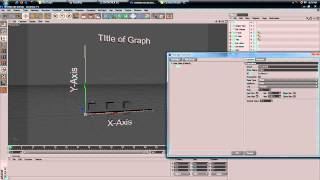
Create an Interactive Animated Bar Graph with Cinema 4D and Xpresso - Part 1
Learn to create dynamic 3D bar graphs in Cinema 4D using Xpresso and Mograph, with automatic updates based on custom settings. Master interactive data visualization techniques.

The Good News of the Decade
Discover unreported global progress as Hans Rosling uses stunning visuals to reframe UN data, revealing positive trends and debunking flawed statistical approaches in this eye-opening presentation.
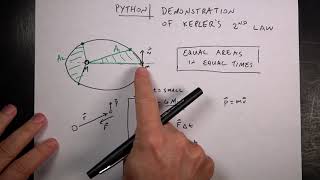
Verifying Kepler's Second Law with Python and Physics
Model planetary orbits and verify Kepler's 2nd Law using Python, demonstrating equal area sectors in equal time periods through orbital motion simulations and sector area calculations.

Shiny - Creating Data-Centric Web Applications in Python
Discover how to build data dashboards and interactive visualizations using Shiny for Python - a framework that eliminates the need for HTML, CSS, and JavaScript while leveraging Transparent Reactive Programming concepts.
Python-based Web Applications for Modern Astronomy and Exoplanet Research
Discover how Python-powered web applications revolutionize exoplanet research, featuring Filtergraph's visualization tools and their impact on NASA missions and astronomical discoveries.