How Quick Can We Be? - Data Visualization Techniques for Engineers
Explore data visualization techniques for engineers, focusing on efficient methods to create impactful visual representations of complex information.

JavaScript Journalism
Explore how JavaScript is revolutionizing digital journalism, enhancing storytelling techniques, and creating interactive news experiences for modern audiences.

Down the Rabbit Hole - Chasing Bugs from the Browser to the Backend
Explore the journey of debugging from browser to backend, learning valuable lessons about user feedback, data visualization, and advanced debugging techniques.

Why Are There So Many Javascript Charting Libraries?
Explore the diverse landscape of JavaScript charting libraries, their similarities, and the reasons behind their proliferation. Gain insights into Palantir's decision to create Plottable.js and the future of data visualization tools.

Secure Crypto for Browser Based Apps
Explore secure cryptography implementation in browser-based apps, focusing on Mailpile's approach to shifting the attack surface while maintaining a user-friendly interface and leveraging JavaScript capabilities.

Server-less Applications Powered by Web Components
Explore server-less web applications using Web Components to create live dashboards with deployment and monitoring stats, leveraging open APIs and AWS JavaScript SDK for a 2-tiered web architecture.

Visualizing Data with JavaScript at Twitter
Exploring Twitter's Visual Insights team's approach to creating interactive data visualizations for global events using web standards, storytelling, and advanced graphics techniques.

The Missing Slice
Explore innovative CSS and SVG techniques for creating flexible, animated pie charts while learning problem-solving strategies for web development with Lea Verou.

Controlling the NES with Javascript
Manipulate NES RAM using JavaScript to create cheats, investigate game mechanics, and generate external visuals. Explore innovative gameplay and augmented experiences through memory manipulation.

Slippy Map Style - Geo-canvas Design with CartoCSS
Explore geo-canvas design using CartoCSS for creating interactive and visually appealing slippy maps in this insightful presentation by Aurelia Moser.

Data Sketches - A Visualization a Month
Explore data visualization through monthly projects, learning from creative experiments, overcoming challenges, and finding inspiration in the iterative process of visual storytelling.

Datasketches - A Year of Exotic Data Visualizations
Explore a year of unique data visualizations with insights on overcoming challenges, iterating designs, and creating compelling visual stories from raw data.

Visualising Enterprise Data with D3
Learn to create powerful data visualizations using D3, from basic concepts to practical implementation. Discover how to transform raw data into meaningful, interactive graphics for your applications.
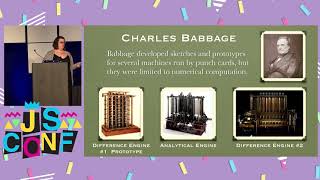
Weaving Tapestries of Code
Explore the fascinating parallels between coding and weaving, uncovering historical connections and drawing inspiration from textile patterns to enhance your programming skills.
DIY Data Visualization in JavaScript while Stanning BTS
Learn to create compelling data visualizations using JavaScript, from selecting subjects to choosing charts, with insights from a K-pop fan's journey analyzing BTS data.

Infrastructure Monitoring Basics with Telegraf, Grafana and InfluxDB
Learn infrastructure monitoring basics using Telegraf, Grafana, and InfluxDB. Explore data collection, storage, visualization, and alerting techniques to ensure system reliability and performance.

The F#orce Awakens
Explore Star Wars data using F# and R to uncover character importance and analyze movie success, while learning data science techniques applicable to various datasets.
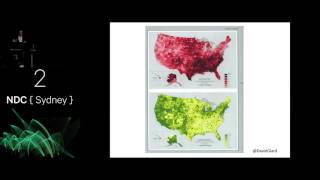
Effective Data Visualization
Learn techniques for creating meaningful and understandable data visualizations based on Edward Tufte's guidelines. Discover what to include, remove, and avoid in charts, graphs, and maps to effectively present data.
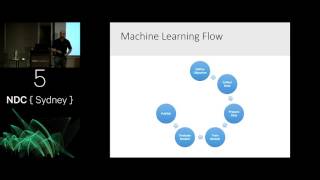
Azure Machine Learning for the Developer
Learn Azure Machine Learning fundamentals and how to leverage cloud-based predictive models. Discover the potential and ease of implementing machine learning in your software development projects.
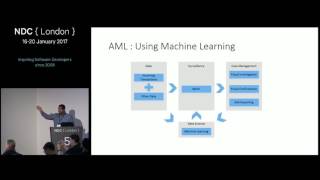
Enhanced AML Fraud Detection Solutions with Azure Machine Learning
Enhance AML fraud detection using Azure Machine Learning to reduce false positives and prioritize flagged items. Learn implementation techniques and explore applications in other financial domains.

Visualizing Olympic Medals with F# and Fable
Explore interactive data visualization of Olympic medals using F# and Fable. Learn functional programming techniques for building web applications and discover insights through modifiable visualizations.