Visualization With Seaborn
Learn to create powerful data visualizations using Seaborn, covering joint kernels, heatmaps, swarm plots, and more. Enhance your Python graphing skills with this comprehensive tutorial.
Seaborn- Understanding the Weird Parts
Explore advanced data visualization techniques using Seaborn, covering various plot types and statistical analyses for effective data representation and insights.
Python Seaborn Complete Tutorial for Beginners
Master data visualization with Python's Seaborn library. Learn to create scatter plots, line charts, box plots, and more through step-by-step tutorials and practical examples.

Intro to Seaborn
Comprehensive video series on Seaborn data visualization library, covering various plot types, styling options, and advanced features for effective data representation in Python.
Seaborn Python Tutorial
Learn data visualization with Seaborn: create scatter plots, line charts, and distribution plots. Master regression models, FacetGrid, and color palettes for effective data analysis and presentation.
Plotly Graphs
Learn to create interactive and visually appealing data visualizations using Plotly in Python, from basic charts to advanced techniques and deployment.

Connecting Plotly Graphs to Dash Components
Learn to create interactive data visualizations by connecting Plotly graphs with Dash components. Master various chart types and enhance user interaction in your Python-based dashboards.

Plotly Dashboards
Learn to create interactive dashboards and data visualizations using Plotly and Dash. Master various chart types, components, and styling techniques for building powerful web applications with Python.
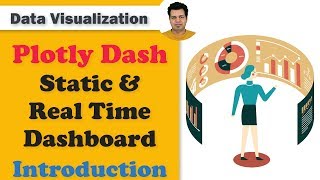
Develop Dashboard for Business Intelligence & Data Science - Plotly Dash Tutorial Series
Learn to create interactive, secure, and deployable dashboards using Plotly Dash for data science and business intelligence applications.

Data Visualization Using Plotly for Python
Learn to create interactive and visually appealing data visualizations using Plotly for Python, covering various chart types and techniques for effective data representation.

Fortran Video Tutorials
Learn essential Fortran programming concepts, from basic syntax to advanced topics like file handling, arrays, and subroutines, through hands-on video tutorials.
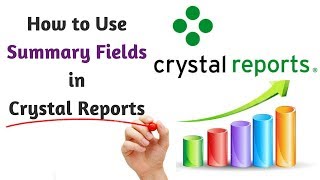
Crystal Reports Tutorial
Learn to create professional reports with summary fields, formatting, headings, and formulas. Step-by-step guide for Visual Studio integration and enhanced readability.
ArcMap 10 Tutorials
Learn essential ArcMap 10 skills, from projecting data views to creating thematic maps and georeferencing, in a concise 30-minute tutorial.
How To- ThinkOrSwim -TOS- Basics Tutorial
Master ThinkOrSwim platform: layout, charts, indicators, scanning, and order placement. Comprehensive guide for beginners to navigate and utilize this powerful trading tool effectively.

Machine Learning with Python - Tutorial for Beginners
Comprehensive Python-based machine learning tutorial covering data manipulation, visualization, statistics, and reinforcement learning, with practical examples and a smart taxi case study.

Python for Data Science - Data Science with Python - Python for Data Analysis
Data science with python starts focuses on an introduction to Python and Python IDEs, followed by looking at data structures in Python. Then we look at object-oriented programming.
Data Visualization with ggplot2 in R
ggplot2 is the most popular package for data visualization. It is based on Grammar of Graphics which makes visualization extremely easy.
Introduction to R 2018
Learn the fundamentals of R programming for data analysis and visualization through hands-on sessions covering key concepts and practical applications.
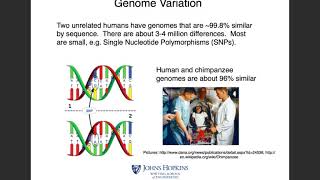
High-Throughput Biology - From Sequence to Networks 2017
Comprehensive exploration of high-throughput biology, covering sequencing, RNA analysis, and network pathways with hands-on tutorials using popular bioinformatics tools.
Informatics on High Throughput Sequencing 2014
Explore high-throughput sequencing tools, variant calling, visual analysis, Galaxy integration, and de novo assembly techniques for advanced bioinformatics applications.
Bioinformatics for Cancer Genomics 2011
Comprehensive exploration of cancer genomics, covering mutations, clinical data integration, pathway analysis, copy number alterations, and gene expression profiling for advanced bioinformatics insights.