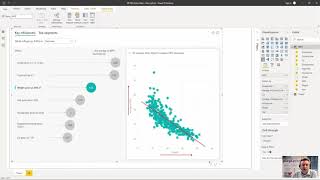
Machine Learning in Power BI
Explore ML tools and features in Power BI, including built-in visuals, Azure Cognitive Services integration, and new ML capabilities in data flows for enhanced data analysis and reporting.

The Data Janitor Returns
Practical insights on data-driven decision-making with limited resources. Covers roles, challenges, and real-world solutions in data management, avoiding hype and focusing on impactful strategies.

Kotlin for Machine Learning
Explore Kotlin's potential in machine learning projects, from data cleaning to model deployment. Learn about Kotlin tools for data science, including Jupyter notebooks, visualizations, and dataframes.
Angular Material 2 Workshop
Learn to build modern, responsive UIs with Angular Material 2. Explore component libraries, theming, and best practices for creating sleek, efficient Angular applications.
Better Histograms for Prometheus
Explore advanced histogram techniques for Prometheus, addressing limitations and proposing efficient high-resolution solutions for improved metrics processing and analysis.
Ingress on the Rails - Use Community Tools to Automate Ingress Provisioning
Automate Ingress provisioning using community tools for secure, monitored HTTPS and HTTP/2 traffic across multiple Kubernetes clusters with ExternalDNS, cert-manager, and more.
Progressive Delivery in Kubernetes
Explore automated Progressive Delivery in Kubernetes using Jenkins X and Flagger, featuring Canary deployments and rollbacks for safer, more efficient software releases.

From Alert Notification to Comparison of Good and Bad Requests in One Click
Explore efficient troubleshooting by linking metrics, traces, and alerts. Learn to compare problematic and normal traces automatically, reducing time-to-mitigation using open-source tools like Prometheus and Jaeger.

Thanos - Highly Available, Pluggable, Long Term Metric Storage for Everyone
Explore Thanos: a scalable, highly available solution for long-term metric storage, enhancing Prometheus capabilities with multi-cluster telemetry, remote writes, and multi-tenancy features.
Practical Kubernetes Monitoring with Prometheus
Learn practical Kubernetes monitoring using Prometheus, covering setup, service discovery, alerting, and advanced topics like SLOs and security. Gain insights into best practices and real-world applications on GitLab.com.
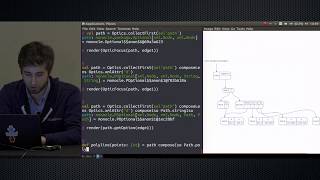
Visualize Your Data Structures
Explore Reftree, a Scala library for creating diagrams and animations of data structures. Learn how functional programming techniques enhance visualization implementation.
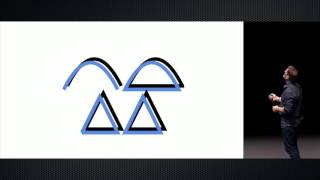
Doodle - Visualisation in Scala
Explore 2D data visualization in Scala with Doodle. Learn to create flexible, customizable graphs for browser, desktop, and file output using functional programming techniques.
Tracking COVID-19 with Ruby
Explore how programmers can aid epidemiologists by gathering and analyzing COVID-19 data using Ruby, web tools, and expressive code to make complex information understandable.
Go for Information Displays
Explore Go's potential for creating compelling information displays and visualizations using SVGo, OpenVG, and dec. Learn to transform data into engaging visual content across various domains.
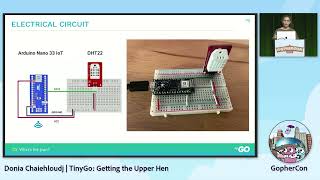
TinyGo - Getting the Upper Hen
Explore TinyGo for microcontrollers: learn to collect henhouse data, use WiFi communication, and build dashboards for remote monitoring. Unleash creativity with Go in small-scale projects.
Avoiding D3 Spaghetti With React
Learn to create reusable, animated visualization components by combining D3's animation performance with React's declarative nature, enabling efficient development of any imaginable visualization.
General Track
Explore cutting-edge React.js topics with expert talks on state management, GraphQL, D3 integration, and more. Gain insights into best practices and emerging trends in React development.

D3 and React, Together
Explore the synergy between D3 and React for data visualization, learning when to use each library and how to combine them effectively for powerful interactive applications.
Visual Feature Engineering for Machine Learning with React
Explore visual feature engineering for machine learning using React and TensorFlow.js to predict soccer match outcomes, with real-time model visualization and training insights.
Data Visualizations and Internationalization - Make Apps for a Global Audience
Learn techniques for customizing React data visualizations for international audiences, covering formatting, design, coding, testing, and localization considerations.
The Language of Shapes - Understanding the SVG Path
Explore SVG paths, their manipulation with React, and interactive shape creation. Learn to read and modify path data for dynamic, accessible, and styleable graphics without relying on design software.