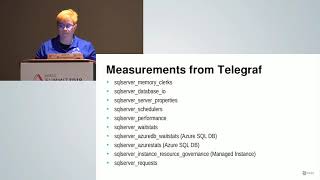
Using Open Source Software to Collect Performance Metrics
Learn to set up an inexpensive system using Telegraf, InfluxDB, and Grafana to collect and visualize SQL Server performance metrics, aiding in troubleshooting and capacity planning.
Azure Machine Learning 101
Explore Azure ML's no-code approach to machine learning, from data preparation to model deployment, suitable for both beginners and experienced data scientists.

No-Code Custom Visuals! Can You Say Charticulator? - I Knew You Could
Explore Charticulator, an open-source tool for creating stunning Power BI custom visuals without coding. Learn to enhance your data visualization capabilities and unlock new possibilities in data presentation.
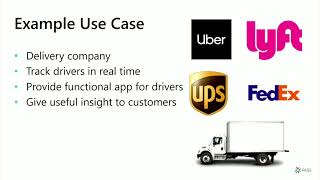
PowerApps and AI - A Flow of Location Events
Explore PowerApps and AI integration for location tracking, using Bing maps, Azure SQL, and Cognitive Services. Learn to create mobile apps with real-time alerts and location-aware web searches.

What's in a Name? Data Stories that Would Make the Bard Proud
Learn to transform U.S. Census Bureau data on children's names into captivating stories. Discover techniques for identifying key data points, creating effective visualizations, and crafting compelling narratives to engage any audience.
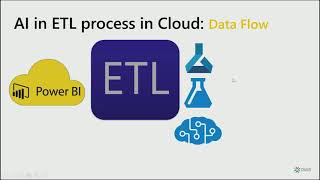
AI for the BI Professional
Explore AI integration in BI solutions for enhanced data insights. Learn to use pre-built AI tools, consume data scientist models, and leverage Power BI's AI features for intelligent reporting.

An Introduction to Data Visualizations and Design Best Practices
Learn effective data visualization techniques, including chart selection, color theory, and design principles to enhance your data storytelling skills and create impactful Power BI reports.
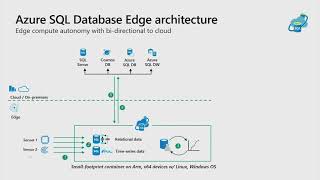
Azure SQL Database Edge - Overview
Explore Azure SQL Database Edge: optimized for edge computing with streaming support, machine learning, and "develop once, deploy anywhere" capabilities. Learn about features, deployments, and customer scenarios.

An Introduction to Data Visualizations and Design Best Practices
Learn effective data visualization techniques, including chart selection, color theory, and design principles to enhance your data storytelling skills and create impactful Power BI reports.
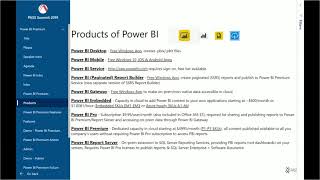
Power BI Premium - Is it for Your Company and Worth It
Comprehensive overview of Power BI Premium features, benefits, and costs to help companies decide if it's the right investment for their data analytics needs.
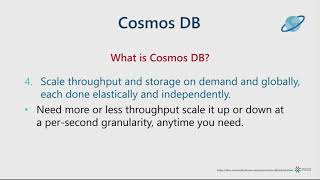
Cosmos DB Develop Locally Deploy Globally
Learn to set up, use, and deploy CosmosDB for globally distributed, scalable database solutions. Explore JSON data loading, PowerBI visualization, and seamless cloud migration.
Think Like the Cardinality Estimator
Explore SQL Server's cardinality estimation process to optimize query performance. Learn how to influence physical operations, handle multiple predicates, and tackle complex query plans.
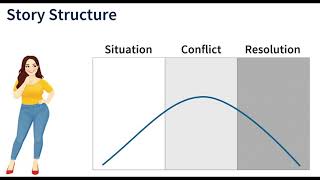
Implementing Data-Driven Storytelling Techniques in Power BI
Learn four data-driven storytelling techniques and their implementation in Power BI to create engaging, easy-to-consume reports with coherent structures that effectively communicate insights.
Designing Reports for Effective Storytelling
Learn effective digital storytelling techniques for creating impactful reports, focusing on color, contrast, layout, and design principles to convey information clearly and professionally.
Aggregation and Composite Model - Power BI Fast and Furious
Optimize Power BI performance with Aggregations and Composite Models. Learn techniques for analyzing terabytes of data in seconds, with live demos and practical tips for handling huge datasets efficiently.
Checking in with Power Apps, Flow, and Power BI
Create a Power App for location check-ins, integrate with Flow to update Power BI data, and build a report displaying user locations on a map using Microsoft's Power Platform tools.
Guiding User Experiences With Advanced Reporting Features
Explore advanced Power BI features to enhance user experience: bookmark capture, button configurations, report tooltips, and measure-based formatting for improved report design and interactivity.
Charticulator - Create Custom Visual with No Code in Power BI
Learn to create custom Power BI visuals using Charticulator without coding. Explore the tool's environment, chart creation process, and importing custom visuals into Power BI desktop.
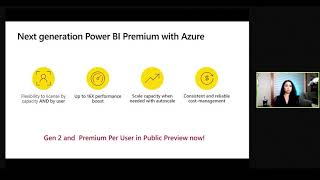
Microsoft Power BI for the Data Engineer
Explore Power BI's capabilities for enterprise-grade insights, performance, governance, and security over massive datasets. Learn simplified data modeling and visualization techniques for actionable insights.
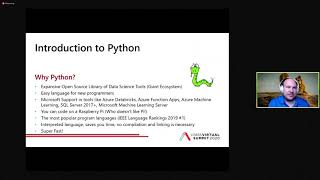
Code Like a Snake Charmer Version 2.0 - Introduction to Python
Comprehensive introduction to Python for data science, covering basics and machine learning using real-world datasets. Ideal for beginners looking to integrate Python into Microsoft tools.
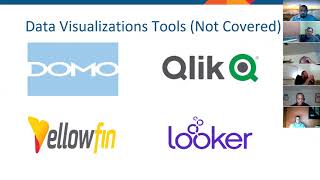
Data Visualization for Entrepreneurs
Learn key differences between data visualization tools, their pros and cons, and how to choose the best one for your entrepreneurial needs.