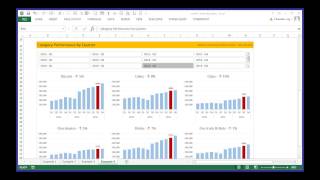
Productivity Revolution in Excel
Discover how to leverage Excel and Power BI for powerful business intelligence. Learn to create charts, dashboards, and formulas, and master data extraction, modeling, and visualization techniques.
Business Intelligence Toolkit Overview - Microsoft Power BI and R
Explore data visualization with Power BI and R, focusing on cognitive psychology theory and practical applications for creating effective dashboards and analyses.
SQL Server 2016 Reporting Services & Mobile BI
Explore modern reporting with SQL Server 2016, featuring enhanced paginated reports, mobile BI, and integration with Power BI. Learn to create interactive, responsive reports for various platforms.
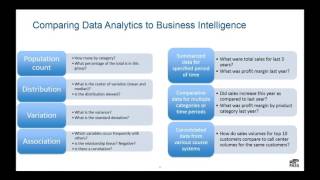
A Gentle Introduction to Data Analytics in SQL Server 2016
Explore data analytics using SQL Server 2016, comparing it to BI and data science. Learn to organize data, use Power BI, R, and Analysis Services for exploration and visualization techniques.
Digital Storytelling with Power BI
Learn to leverage Power BI's features for effective data storytelling, guiding users to better understand their information through visualization and narrative techniques.
Data Storytelling 101
Learn effective data storytelling techniques to create impactful visual narratives, focusing on key elements like goal-setting, snapshots, and actionable insights for compelling business intelligence presentations.
Building Modern Data Pipelines with Spark on Azure HDInsight
Explore common patterns for building end-to-end data analytics pipelines using Apache Spark on Azure HDInsight, covering architecture, integration points, and various pipeline options.

From Power BI to Power AI
Explore integrating R, Azure Machine Learning, and advanced Power BI features for enhanced data insights and automated analysis capabilities.

Dashboard Designing - From 0 to Hero
Transform raw data into actionable insights with Power BI. Learn data modeling, visual slicing, report creation, and advanced features for effective dashboard design.
Data Storytelling with Power BI
Discover effective techniques for transforming Power BI reports into compelling digital narratives, leveraging storytelling capabilities to create impactful data presentations.

Modelado y carga de datos con SSAS
Explora el papel de SSAS en Azure para soluciones BI, aprende sobre modelado y carga de datos, y descubre cómo visualizar información con Power BI y Excel.
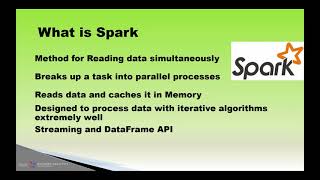
Using Azure Databricks to Develop Scalable Data Solutions
Develop scalable data solutions using Azure Databricks for efficient processing, collaborative development, and seamless integration with Azure services and Power BI visualization.

Can You Say Charticulator - Create Amazing Power BI Custom Visuals with No Code Using Charticulator
Explore Charticulator, an open-source tool for creating custom Power BI visuals without coding. Learn to enhance data visualization and unlock new possibilities for your Power BI reports.
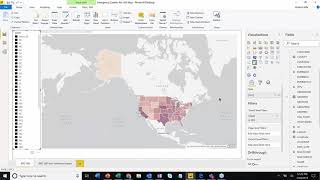
Data Here, There and Everywhere - Cloud
Explore Power BI's mapping capabilities for geographical data analysis, including standard maps, ESRI options, and data visualization techniques to effectively represent location-based information.

Analytics on AWS
Explore AWS analytics services like Data Migration, S3, Athena, and QuickSight. Learn to build cloud-based analytics solutions using Amazon's infrastructure, platform, and software services.

Power BI From 0 to Hero - Analytics
Comprehensive Power BI tutorial covering data loading, modeling, report design, and advanced features. Learn to create impactful visualizations and leverage Power BI's full potential for data analysis.
Analytics Spotlight - The New Analyst
Explore evolving analytics trends, skills, and technologies for business analysts. Learn to work with data science, improve data literacy, and embrace ambiguity in modern business intelligence.
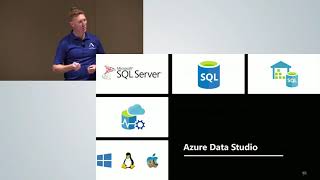
Azure Data Studio - The New Frontier
Explore Azure Data Studio's features for managing data platforms, including dashboards, snippets, profiling, charting, and more. Learn when to use it over SQL Server Management Studio.

Code Like a Snake Charmer – Advanced Data Modeling in Python
Comprehensive Python data modeling tutorial covering extraction, cleaning, transformation, visualization, predictive modeling, validation, and deployment using popular libraries and Azure integration.
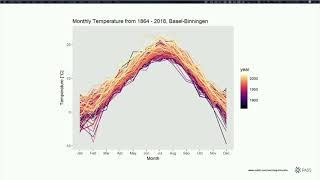
Two Truths That's A Lie - Data Visualization Ethics
Explore data visualization ethics, examining how color and chart choices influence storytelling. Learn to create truthful, impactful visualizations while protecting your company's reputation.
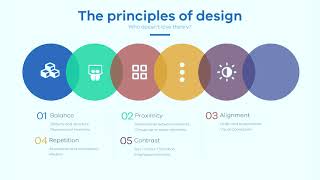
Design Strategies and Advanced Data Visualization
Advanced techniques for effective data visualization, including accessibility design, data storytelling, and creating impactful reports and dashboards for diverse audiences.