Python Profiling State of the World
Explore various open-source Python profiling technologies, their tradeoffs, and visualization methods like flow charts, call trees, and flamegraphs in this hands-on workshop.
How to Create Beautiful Interactive GUIs and Web Apps
Learn to create interactive GUIs and web apps using streamlit in Python. Hands-on exercises cover basics, data visualization, custom layouts, and integration with popular libraries for effective data science projects.
Feature Engineering is for Everyone
Explore feature engineering techniques for data visualization, automation, and machine learning. Learn to create and select features from various data types using encodings, vectorization, and date manipulation.
Data of Unusual Size - Interactive Visualization
Learn techniques for analyzing and visualizing massive datasets using Python libraries like Dask and hvPlot. Explore efficient data formats, parallel computation, cloud resources, and interactive visualization for large-scale data science projects.
Making Use of OpenStreetMap Data with Python
Explore OpenStreetMap data manipulation using Python, learning techniques to extract, analyze, and visualize geographic information for various applications.
Meteorology, Climate and Python - Desperately Trying to Forget Technical Details
Explore meteorology and climate analysis using Python, focusing on practical applications and data visualization techniques while avoiding unnecessary technical complexities.
Visualization and Analysis of Large Scale Datasets with Python
Explore techniques for visualizing and analyzing big data using Python, focusing on efficient methods to handle large-scale datasets and extract meaningful insights.
Visualization and Analysis of Large Scale Datasets with Python
Explore techniques for visualizing and analyzing big data using Python, focusing on efficient methods to handle large-scale datasets and extract meaningful insights.
The London Python Code Dojo - An Education in Developer Education
Explore collaborative coding, problem-solving, and skill development in a fun, community-driven environment. Learn from peers, celebrate failures, and enhance your programming abilities through hands-on practice.
Python for Finance Part 1
Learn to leverage Python for financial analysis, modeling, and algorithmic trading. Explore practical applications in quantitative finance and risk management.
Getting More Out of Matplotlib with GR
Enhancing Matplotlib performance with GR framework for high-speed data visualization, real-time applications, and improved 3D rendering. Explore interoperability with GUI toolkits and OpenGL.
Multibody Simulation Using Sympy, Scipy and Vpython
Explore multibody simulation using Python packages sympy, scipy, and vpython for engineering and educational purposes. Learn to formulate mechanical problems and integrate equations.
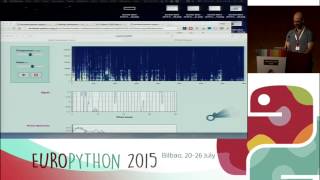
Big Data Beautiful Visualization on the Browser with Bokeh
Explore interactive data visualization using Bokeh, a Python library for creating web-based graphics. Learn its design, API layers, and powerful features through comprehensive examples.
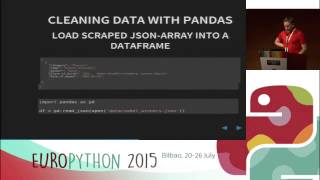
Data-Visualisation with Python and Javascript - Crafting a Data-Viz Toolchain for the Web
Explore data visualization using Python and JavaScript, from scraping and cleaning data to creating engaging web visualizations with tools like Scrapy, Pandas, Flask, and D3.js.
Hyperconvergence Meets BigData
Explore deploying Wendelin, a Big Data & Machine Learning platform, using SlapOS, a hyperconverged OS. Learn to create and manage a complete Big Data infrastructure with Python-based tools.
OMG, Bokeh is Better Than Ever!
Explore Bokeh's powerful features for creating complex visualizations in Python, including websocket-based server, JavaScript callbacks, and high-level charts for enhanced data representation.
Interactive Data Kung Fu with Shaolin
Explore interactive data analysis with Shaolin, a Python framework for building complex dashboards using widgets. Learn to create dynamic visualizations and process real-world data effortlessly.
Un Vector por Tu Palabra
Exploración de representación distribuida de palabras y su aplicación en clasificación de textos de redes sociales, utilizando el ecosistema científico de Python para experimentos replicables.
Datu bistaratze soluzioen garapena Smartcity proiektuetan
Smartcity proiektuetarako Django-rekin garatutako web orria, energia kontsumoa modu argi eta sinplean bistaratzeko, erabiltzailean oinarritutako diseinuarekin eta hainbat hizkuntzatan.
Jupyter for Everything Else
Explore unconventional uses of Jupyter beyond scientific exploration, including command-line tutorials, interactive presentations, and web technology experimentation.
Python, Data & Rock'n'Roll
Explore rock music lyrics using data science techniques like web crawling, NoSQL, NLP, and visualization to uncover trends, themes, and correlations among legendary bands.