NetworkX Visualization Powered by Bokeh
Interactive network visualization using NetworkX and Bokeh in Jupyter Notebooks. Learn to create, manipulate, and update network structures with Python, enhancing data exploration and analysis of social networks.
How to Create Inspiring Data
Explore the process of creating engaging data visualizations, from concept to execution, with insights on inspiring and captivating audiences through creative visual storytelling techniques.
Facing the Challenge of Climate Change with Xarray and Dask
Explore climate data analysis using xarray and Dask, leveraging Python's scientific ecosystem to process and visualize complex climate forecasts and projections from the Copernicus Climate Change Service.
Inside Airbnb - Visualizing Data That Includes Geographic Locations
Aprende a visualizar datos geográficos utilizando herramientas como Bokeh, Holoviews y Datashader. Explora técnicas para representar información de Airbnb en mapas interactivos y dashboards dinámicos.
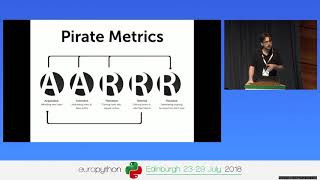
Using Bonobo, Airflow and Grafana to Visualize Your Business
Hands-on introduction to building business dashboards using Bonobo ETL, Airflow, and Grafana. Learn to create data pipelines, visualize metrics, and improve business insights through practical examples and real-world data.
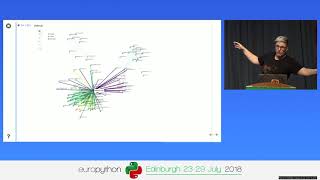
The Web is Terrifying - Using the PyData Stack to Spy on the Spies
Explore online tracking technologies and data visualization using PyData tools. Gain insights into internet privacy, GDPR implications, and the journey of becoming a self-taught data scientist.
Debugging Your Code with Data Visualization
Explore debugging techniques using data visualization tools to understand complex code behavior, illustrated with real-world examples from AWS CLI and boto3 development.
Lies, Damned Lies, and Statistics
Explore common statistical fallacies and learn to recognize misleading data interpretations. Gain insights on correlation, bias, and significance to draw accurate conclusions from statistics.
Getting Your Data Joie De Vivre Back
Explore data-driven creativity through AI and visualization, from poetry composition to image reconstruction, blending technical skills with artistic expression for fun and learning.
Geospatial Analysis Using Python and JupyterHub
Explore geospatial data processing and visualization using Python, covering vector and raster analysis, deep learning applications, and high-performance computing techniques for efficient spatial data handling.
PlotVR - Walk Through Your Data
Explore 3D data visualization with PlotVR, enabling immersive VR and AR experiences. Navigate scatter plots using your phone and computer keyboard for a unique perspective on your datasets.
The Python Data Visualization Landscape in 2020
Explore Python's data visualization libraries including Matplotlib, Plotly, Bokeh, and Altair. Learn about dashboarding solutions like Dash, Panel, and Voila, and understand their key features and recent developments.
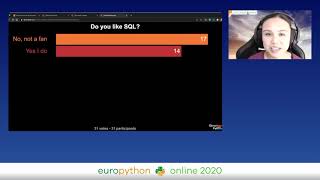
How to Be Pythonic - Design a Query Language in Python
Explore the design of WOQLpy, a Python query language for TerminusDB. Learn about challenges, methods, and best practices in creating Pythonic packages, with interactive discussions on effective Python design.
Interactive Mapmaking with Python
Explore interactive mapmaking using Python and GeoDataframes. Learn to create visually appealing maps with libraries like Folium, Kepler.gl, and Plotly, and discover Geopatra for simplified geodata visualization.
Digital Transformation in the Fight Against Coronavirus
Explore how Goiás state in Brazil leveraged digital transformation and machine learning to enhance public services and information dissemination during the COVID-19 pandemic.
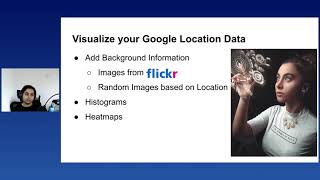
Virtual Tourism in COVID Times
Explore building an interactive dashboard using Python to relive past travels during lockdown. Learn data processing, visualization, and integration of external sources for a personalized virtual tourism experience.
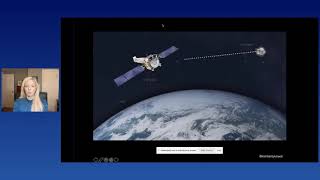
Our Universe through Sight, Sound & Touch
Explore the cosmos through innovative sensory experiences: listen to stellar explosions, walk through the Milky Way in VR, and feel vibrations of stellar nurseries. Transform 2D data into immersive, multi-dimensional encounters with our universe.
A Gentle Introduction to Causal Inference
Explore causal inference techniques to uncover relationships in observational data, avoid misinterpretation pitfalls, and extract deeper insights beyond simple correlation calculations.
Analyzing COVID Vaccine Popularity in Europe Using FastAPI, Postgres & Azure
Explore COVID vaccine data analysis using FastAPI, Postgres, and Azure. Learn to process, store, and visualize European vaccine popularity data with Python tools and cloud services.
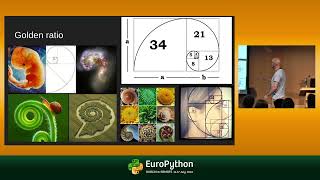
Using Python to Predict Asset Price Reversals
Learn to predict potential trend reversals in stocks and cryptocurrencies using Python, Pandas, and Plotly. Discover how to identify Fibonacci retracement levels for low-risk trade entries.
Use Animated Charts to Present & Share Your Findings with Ipyvizzu
Learn to create engaging animated charts for data storytelling using ipyvizzu. Explore chart taxonomies, morphing engines, and best practices for impactful presentations.