
Data Visualization with R
Learn to create impactful data visualizations using R and RStudio. Explore R's capabilities for transforming data into actionable insights through hands-on demonstrations and expert guidance.
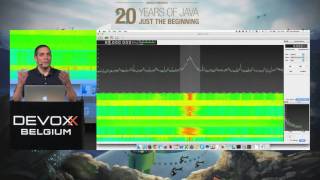
Decoding the Air Around You with Java and $7 Hardware
Explore software-defined radio using cheap hardware to decode maritime and aviation signals, visualizing real-time ship and airplane data in a web application.
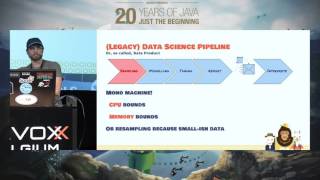
Towards a Rebirth of Data Science
Exploring the evolution of Data Science methodologies and tools in the age of Big Data, emphasizing rapid insights and value delivery in high-velocity data environments.
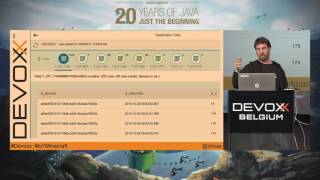
Visualization IoT Data With Minecraft
Explore innovative ways to visualize IoT data using Minecraft on Raspberry Pi, moving beyond traditional charts to interactive 3D representations.

Rethinking Metrics - Metrics 2.0
Explore innovative approaches to organize and leverage metrics for enhanced data visualization, automated dashboards, and advanced fault detection in complex systems.

The Art of Turning Data into Sculptural Recordings
Explore the intersection of data and art as Kate Ive transforms information into tangible sculptures, inspiring new perspectives on our impact and connection to the world.

Monitoring at Scale - Intuitive Dashboard Design
Explore intuitive dashboard design for large-scale monitoring, focusing on cognitive science principles to create effective visualizations that aid quick decision-making and system health evaluation.

Finding Traffic Anomalies Using SSL Certificates
Explore techniques for detecting traffic anomalies using SSL certificates, including metadata analysis, Python scripting, and visualization tools for enhanced network security monitoring.

Explorations in Interactive Visual Analytics
Exploración interactiva de análisis visual de big data, abordando desafíos técnicos y humanos para científicos de datos. Presenta técnicas de visualización, principios de diseño y flujos de trabajo para analizar eficazmente grandes volúmenes de informaci…

Deeper Data Dimensions with Kibana
Explore open-source log analysis with Kibana in this demo-heavy session. Learn about past, present, and future developments for efficient data visualization and analysis.

Your Superpower User Manual
Explore how to leverage cloud services and Python tools for data analysis and visualization, unlocking your potential to tackle practical questions with powerful computing resources.

Visualizing IoT Data with Minecraft
Explore innovative IoT data visualization using Minecraft. Learn how to represent sensor data in a unique, interactive 3D environment, moving beyond traditional charts and graphs.

Keep it Clean - Why Bad Data Ruins Projects and How to Fix It
Explore data quality issues in ML projects, their impact, and solutions. Learn to identify and fix bad data for improved project outcomes and performance.

Quantified Self - From Data to Actionable Dashboards
Explore how software engineers leverage data and automation to simplify life, transform data pushes into pulls, and utilize dashboards for personal and professional problem-solving.

Profiling Malicious Actors
Explore techniques for identifying and understanding malicious actors in cybersecurity, including profiling methods, frameworks, and analytical tools for threat assessment.
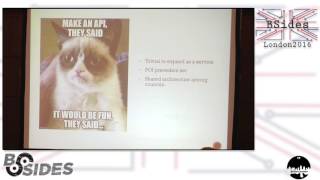
Bytes Between the Lines - Hidden Data in Plain Sight
Explore hidden data risks in seemingly innocuous datasets through a real-world example of parking ticket data analysis, revealing potential privacy and security implications.

There Are No Shortcuts in Organizing, but Technology Sure Does Help
Explore how tech skills enhanced workplace organizing efforts, featuring data visualization, automation, and web development techniques used by the Times Tech Guild to boost solidarity.

Efficient Texture Streaming in Titanfall 2
Explore Respawn Entertainment's texture streaming approach for Titanfall 2, covering preprocessing, data streaming, pipeline, and texture prioritization using histograms.

Assassin's Creed Origins - Monitoring and Validation of World Design Data
Explore Ubisoft's innovative approach to world design data management in Assassin's Creed: Origins, featuring automated tests and visual reports for efficient team communication and quality assurance.
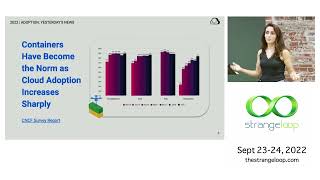
What We Learned Dissecting the World's Most Popular Containers
Insights from analyzing popular container images: security risks, complexity, and trade-offs between developer experience and production readiness in Kubernetes environments.
DataInk - Direct and Creative Data-Oriented Drawing
DataInk: A novel system for creating expressive data visualizations through direct pen and touch input, bridging the gap between automated tools and manual sketching for flexible, creative data representation.