Observability with Consul Connect
Explore setting up and observing a service mesh platform using Consul Connect, focusing on effective monitoring through metrics, logs, and traces with Prometheus, Loki, Tempo, and Grafana.
Dash - Interactive Data Visualization Web Apps with No Javascript
Explore interactive data visualization web apps using Dash, a Python framework that eliminates the need for JavaScript. Learn best practices, pitfalls, and when to transition to traditional web development.

Getting Started with Observability Lab - Opentracing, Prometheus, and Jaeger
Hands-on lab exploring observability tools for cloud-native applications. Install and use Prometheus, Grafana, and Jaeger to monitor Kubernetes clusters and instrument microservices for improved troubleshooting and diagnostics.
Latency SLOs Done Right
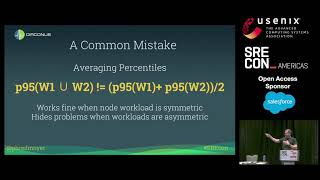
Explore correct approaches to calculating latency SLOs using histograms and mathematically accurate quantiles, improving service level objectives for more effective monitoring and performance management.
Improving Usability of Differential Privacy at Scale
Explore a framework enhancing Differential Privacy usability, allowing practitioners to visualize privacy-utility trade-offs and simplify complex concepts for better implementation and understanding.
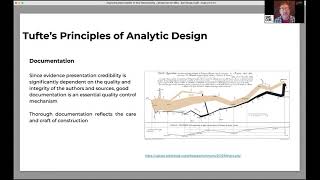
Improving Observability in Your Observability - Simple Tips for SREs
Practical tips for SREs to enhance data visualization in dashboards, drawing inspiration from historical figures and avoiding common pitfalls to improve information density and credibility.
ELK Stack for Hackers
Explore ELK stack's potential for hackers: learn to leverage Elasticsearch, Logstash, and Kibana for efficient log analysis, data visualization, and enhanced security insights.
Weaving Fairytales with Data
Discover the art of data storytelling with three key takeaways: first principles thinking, talking headers, and fairytale magic. Learn to craft memorable narratives that bring data to life.
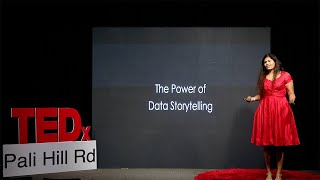
Data Storytelling for Effective Business and Data Communication
Discover how to transform complex data into compelling narratives, enhancing business communication and decision-making through effective data storytelling techniques.
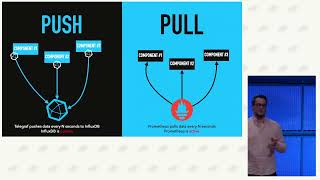
Modern Observability - Scalable Observability with the LGTM Stack - Harnessing the Power of Loki, Grafana, Tempo, and Mimir
Explore advanced observability using the LGTM stack (Loki, Grafana, Tempo, Mimir). Learn how it integrates with OpenTelemetry to enhance monitoring and tracing for high-performance systems.
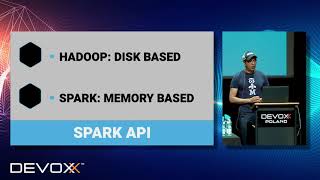
Data Visualization, Processing and Machine Learning - on the JVM with Apache Zeppelin
Explore data visualization, processing, and machine learning using Apache Zeppelin's interactive notebooks. Learn to ingest, discover, analyze, and visualize data with multiple backends, including Spark and JDBC.
Data and the Environment at Port of Rotterdam
Explore real-time data processing for environmental monitoring at Europe's largest port, combining diverse sources to create actionable insights and support sustainability goals.
Performance Tuning Twitter Services with Graal and Machine Learning
Explore Twitter's performance optimization using Graal and machine learning, focusing on autotuning inlining parameters to reduce datacenter costs and improve efficiency.
Create Your Own Music Recommendation System Using ML
Learn to build a music recommendation system using machine learning, exploring algorithms like K-means, SVM, and neural networks with Spotify's API, Keras, and Sklearn.
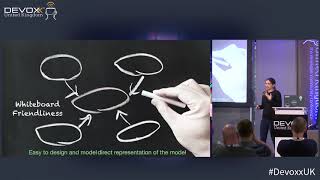
Get to Know the Real World - Discovering Connected Data
Explore graph databases: transform applications with connected data models. Learn creation, querying, and visualization techniques. Discover Cypher language basics and practical tools for interfacing with graph databases.
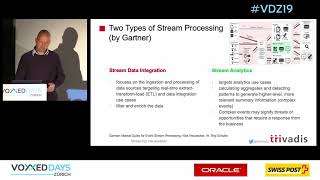
Streaming Visualisation
Explore streaming data visualization techniques, from traditional approaches to dedicated solutions. Learn architecture blueprints and tools for real-time data analysis and presentation.
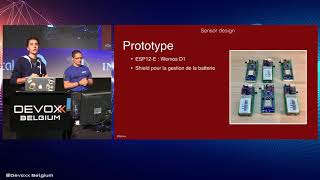
Connected Sensors and Data Visualization to Measure Hardness at Work
Explore sensor-based measurement and visualization of workplace hardness, covering physical constraints, environment, and work rhythms using Arduino, MQTT, and data analysis tools.
Istio, We Have a Problem! Understanding and Fixing Bugs with a Service Mesh
Explore Istio service mesh for debugging, monitoring, and deploying microservices. Learn to use Service Graph, Prometheus, Grafana, and traffic mirroring for effective problem-solving and blue-green deployment.
Fast Cars, Big Data - How Streaming Can Help Formula 1
Explore real-time data streaming and analysis in Formula 1 racing using Apache Kafka, Spark, and Drill. Learn how to capture, process, and visualize high-volume automotive data for performance insights.
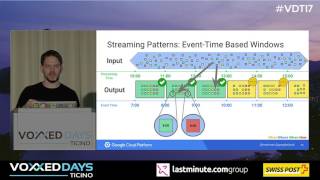
Improve Your App UX with One Model Processing Insights from Batch and Streams
Learn to enhance app UX using a unified model for batch and stream processing. Explore Dataflow's capabilities through a real-time demo, gaining practical insights on managing and visualizing data streams.
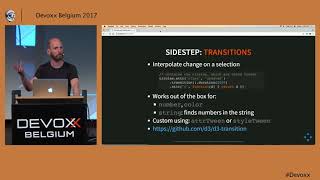
D3.js - Easy and Flexible Data Visualisation Using Web Standards
Learn to create beautiful, interactive data visualizations using D3.js v4. Explore key concepts, APIs, and advanced features like animations, diagrams, and geo/gis for minimal-code, impactful web-based visualizations.