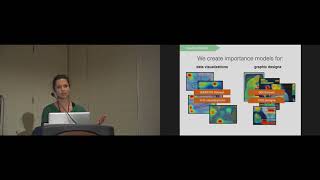
Learning Visual Importance for Graphic Designs and Data Visualizations
Explore AI-driven models predicting visual element importance in designs and data visualizations, with applications in retargeting, thumbnailing, and interactive design tools.

Design Power BI Reports
Guidance on selecting appropriate Power BI visuals for effective report design, covering various types and their applications to enhance data presentation and layout.
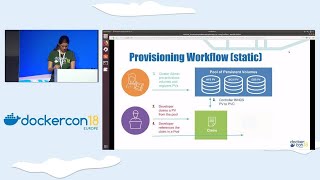
Provisioning and Managing Storage for Docker Containers
Explore Docker container storage concepts, focusing on provisioning, management, and advanced features for stateful applications. Learn about persistent volumes, data availability, and monitoring.

New and Old Empires
Explore how geography and historical civilizations shape modern geopolitics through interactive maps and expert insights on shifting alliances, emerging patterns, and global challenges.
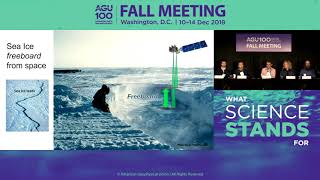
First Results from NASA’s New Ice-Measuring Space Laser
NASA scientists present groundbreaking data from ICESat-2, revealing detailed Earth surface features and ice measurements. This innovative space laser provides crucial insights for climate research and sea level predictions.
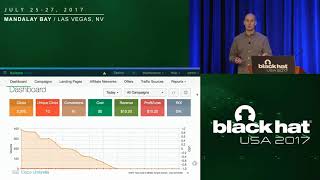
Exploit Kit Cornucopia
Explore creative techniques for detecting Exploit Kit infrastructure, including compromised websites, gates, and dedicated hosts, while understanding their underlying architecture.
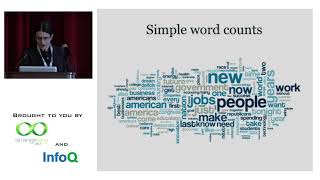
How Does Text Become Data
Explore concept-based text understanding and its applications in NLP. Learn to build models of human thinking for search engines, recommender systems, and classifiers using practical examples and code.

Scalable Anomaly Detection - With Zero Machine Learning
Explore Netflix's innovative approach to detecting anomalies in complex distributed systems using stream processing and simple algorithms, without relying on machine learning.
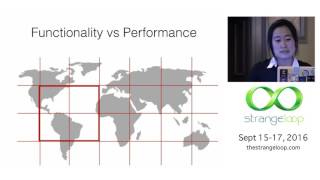
Knowing What You See - Let's Talk About Front-end Consistency
Explore techniques for maintaining consistency in interactive data visualizations, addressing asynchrony challenges and applying database transaction principles to enhance user experience.
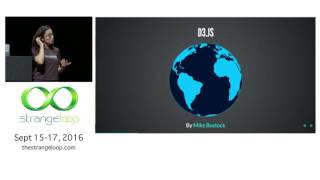
Storytelling with Your Data
Explore data visualization techniques using Angular2, ngAnimate, and RxJS to create interactive, high-performance storytelling experiences at 60fps.
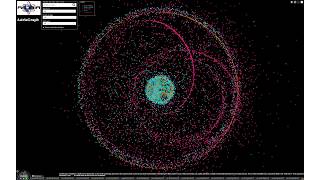
ASTRIAGraph - Toward an Open, Transparent, and Crowdsourced Space Traffic and Environment Monitoring and Awareness System
Explore space traffic monitoring with ASTRIAGraph, an innovative system for tracking and identifying objects in orbit, addressing challenges in space safety and sustainability.
Lies, Damn Lies, and Metrics
Explore the pitfalls of metrics analysis and learn strategies to extract actionable insights beyond raw numbers in software development and operations.
Measure All The Things with App Metrics
Learn to implement App Metrics in ASP.NET Core applications, exploring metrics, time series databases, dashboards, and best practices for effective monitoring and observability in .NET environments.
Social Network Analysis - A Scary Primer
Explore unconventional data fusion techniques to analyze social networks, revealing insights from digital footprints and real-world sensors. Learn about graph theory and its applications in personal data analysis.
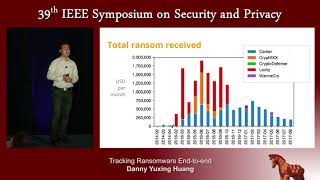
Tracking Ransomware End-to-end
Comprehensive analysis of ransomware ecosystem, tracing financial transactions from victim payments to operator cash-outs. Explores Bitcoin's role in cybercrime and potential countermeasures.
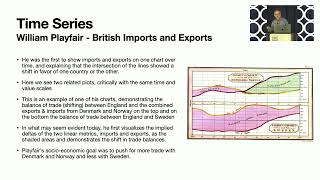
Improving How We Observe Our Observability Data - Techniques for SREs
Explore techniques to enhance observability data visualization for SREs, including multivariate relationships, small multiples, and sparklines, while avoiding common pitfalls in engineering presentations.
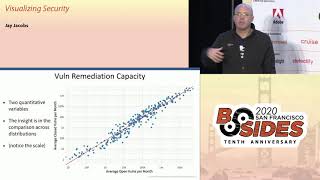
Visualizing Security
Explore data analysis and visualization techniques for security through real-world examples, covering various chart types and data transformation methods to enhance security insights.
Serverless Osquery Backend and Big Data Exploration
Explore serverless osquery backend deployment, scalability challenges, and large-scale data processing for enhanced intrusion detection and endpoint management.
Deep Impact - Recognizing Unknown Malicious Activities from Zero Knowledge
Innovative approach to detect unknown malicious activities using machine learning and image processing techniques on standard device logs, overcoming limitations of traditional security methods.
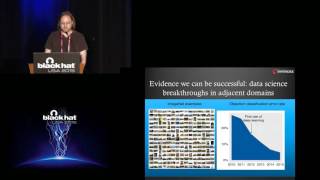
Why Security Data Science Matters and How It's Different
Explore security data science challenges and solutions, including machine learning for attack detection, threat intelligence, and malware analysis, with focus on overcoming unique security-specific obstacles.
Untangling the DOM for More Easy-Juicy Bugs
Explore dynamic JavaScript analysis with Hookish!, an open-source Chrome extension for penetration testing. Learn to uncover DOM-based vulnerabilities and enhance web app security assessments.