Feature Exploration, Visualization, and Predictive Modeling with R and Azure ML
Explore predictive analytics using the Titanic dataset. Learn feature exploration and visualization with R, then build models using Azure ML Studio for efficient experimentation.
Visualizing SpaceX Launches With Python - Full Tutorial
Learn to create a web application visualizing SpaceX launch data using Python, Flask, HTML, and CSS. Covers API integration, data display, and deployment for global access.
Building ASP.NET Core Application with REST API and Charts
Learn to build interactive dashboards and charts in ASP.NET Core using FusionCharts. Create a weather application with REST API integration, data visualization, and responsive design techniques.

Making a CV with R and RStudio: Professional and Semantic
Learn to create professional CVs using R and RStudio with the vitae package. Explore 6 templates and leverage markdown for customization in this efficient, programmer-friendly approach to resume building.
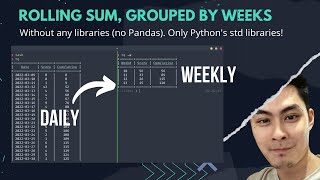
Creating Rolling Sum Grouped by ISO Weeks Using Python - No Pandas Required
Learn to implement weekly rolling sums using Python's standard library, exploring itertools' groupby, enumerate, and isocalendar. Enhance your data manipulation skills without relying on external libraries like pandas.
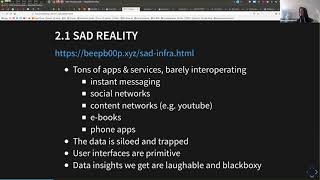
My Life in a Python Package: A Human Programming Interface
Explore the Human Programming Interface (HPI), a Python package for personal data management and analysis, with insights from its creator.
Making Sense of Large Java and Kotlin Classes - Understanding and Refactoring Complex Codebases
Learn techniques to analyze and understand large Java and Kotlin classes, including behavioral code analysis, data visualization, and dependency structure matrices. Gain insights for effective refactoring and codebase comprehension.

Build Beautiful Angular Apps with Bootstrap and Spring Boot
Learn to create stunning Angular applications with Bootstrap, integrating security, customization, and advanced features like searchable data tables and pagination using Spring Boot and JPA.

IntelliJ IDEA - Writing Tests with Spock
Learn to write and run unit tests using the Spock framework in IntelliJ IDEA. Covers project setup, assertions, mocking, data-driven testing, and best practices for effective test creation.
Closing Keynote - Interactive Surfaces and Spaces 2020
Explore cutting-edge insights on interactive surfaces and spaces in this captivating keynote by Pourang Irani, delving into the future of human-computer interaction and spatial computing.
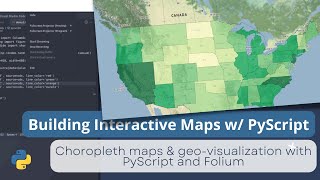
Building an Interactive Map with Folium and PyScript - Tutorial 5
Learn to create interactive maps using PyScript and Folium. Build choropleth visualizations for Indonesia and US unemployment data, then deploy your project on GitHub Pages.

Flow of Program - Flowcharts & Pseudocode
Learn to visualize algorithms using flowcharts and convert them into pseudocode. Explore if conditions, loops, and efficient prime number detection. Gain practical insights for improved program flow and algorithm design.
Build a Gmail App with MDB - Bootstrap 5 & Material Design 2.0 Tutorial
Learn to build a Gmail-like app using MDB 5, Bootstrap 5, and Material Design 2.0. Create customized interfaces with buttons, contacts, lists, and data tables for a modern email application.
Admin Dashboard - Website Analytics with Bootstrap 5 & Material Design 2.0
Learn to build a traffic dashboard with Bootstrap 5 & Material Design 2.0. Create charts, tabs, date pickers, and enhance sidenav and navbar for effective data visualization in admin panels.
Python Projects for Beginners in 2024
Explore diverse Python applications: data visualization, game development, mobile apps, and web development. Gain hands-on experience through practical projects and enhance your programming skills.
Python Tutorial with Generative AI for Beginners - Full Course 2024
Comprehensive Python tutorial covering basics to advanced topics, including OOP, data structures, algorithms, machine learning libraries, generative AI, automation, and GUI development.
Rapid LLM Prototyping with OpenAI, Databricks, and Streamlit
Discover how to create efficient chatbots using OpenAI and Streamlit for data visualization and simulation, enhancing internal processes in insurance and asset management.
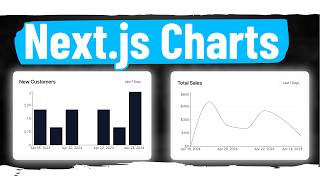
How to Make Beautiful Charts in Next.js
Learn to create robust, beautiful charts in Next.js with step-by-step guidance on setup, various chart types, date range filters, and interval improvements for e-commerce dashboards.
Quantitative Method for Open Source Contribution Value and Its Impact on Business Strategy
Explore Sony's shift to quantitative analysis of open source contributions, its impact on business strategy, and methods for demonstrating value to executives and engineers.
Distributed Load Testing with k6
Explore k6, an open-source load testing tool. Learn to create scenarios, set checks, define thresholds, and visualize metrics. Discover how to scale tests across multiple nodes for distributed load testing.

Building a Stocks Price Tracker with React Native - Step-by-Step Tutorial
Build a React Native stocks price tracker app with UI design, API integration, price tracking, favorites system, and graphical stock history representation using StepZen for GraphQL API.