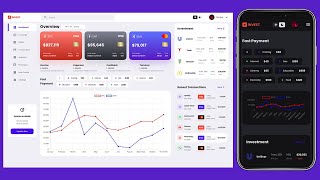
Responsive Admin Dashboard Using HTML, CSS, and JavaScript With Light & Dark Mode
Create a responsive admin dashboard with HTML, CSS, and JavaScript, featuring light and dark modes, modern design elements, and mobile-friendly layout.
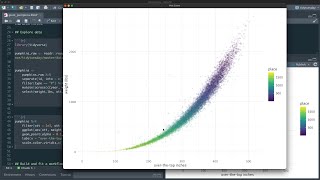
Predict Giant Pumpkin Weights With Tidymodels Workflowsets
Learn to predict giant pumpkin weights using tidymodels workflowsets. Explore data visualization, modeling techniques, and parallel processing for efficient analysis of #TidyTuesday pumpkin competition data.
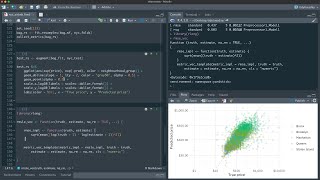
Create a Custom Metric with Tidymodels and NYC Airbnb Prices
Learn to create custom metrics, predict Airbnb prices, and combine tabular and text data in models using tidymodels with NYC listings data.
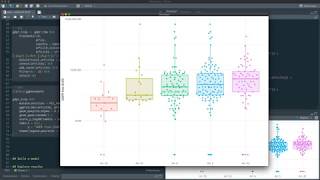
Modeling GDPR Violations in R With Tidymodels
Explore data preprocessing and modeling for GDPR violations using tidymodels in R. Learn feature engineering, workflow creation, and prediction techniques with real-world data.
Lasso Regression with Tidymodels and The Office
Implement lasso regression using tidymodels and The Office data to learn regularized modeling techniques in R, with practical examples and visualizations.
Get Started With Tidymodels Using Vaccination Rate Data
Explore MMR vaccination rates using tidymodels in R, from data preparation to Bayesian modeling and result comparison.
Using Azure Databricks Dashboards - Can They Replace Power BI?
Explore Azure Databricks Dashboards as a potential Power BI alternative, learning to create and utilize this often-overlooked feature for data visualization and analysis.
Azure Databricks with R - Deep Dive
Explore Azure Databricks using R for big data and machine learning. Learn Spark architecture, APIs, workspaces, and data manipulation techniques for efficient cloud-based analytics.
Develop Custom Web Dashboards in R with Shiny
Create interactive data visualization dashboards using R's Shiny package. Learn to develop and deploy web-based applications for effective data presentation and analysis.
Quick Intro to R
Learn to install and use R programming language, covering basics like data creation, functions, statistics, and visualizations in this quick introduction.

Matplotlib Tutorial for Beginners
Learn to visualize data with Matplotlib in Python. Master line charts, limit values, and figures to create compelling data representations for analysis and presentation.
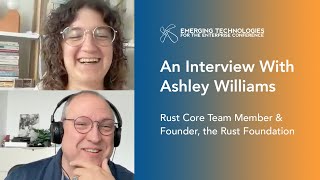
Rust Programming Language Core Team Interview with Ashley Williams - TechChat Tuesdays
Exclusive interview with Ashley Williams, Rust Core Team member and Rust Foundation founder, discussing the programming language's development and future.
The Matplotlib Crash Course
Learn to create, label, and customize graphs using Matplotlib, including axes manipulation, zooming, and creating subplots in this concise tutorial.
Designing Workhorse Tools: Building Integrated Experiences for Power Users
Explore techniques for designing integrated, powerful tools for professionals. Learn about atomic design, view types, and creating seamless experiences in complex software platforms.
Build a Crypto Dashboard
Build a crypto dashboard using React and APIs. Learn to set up the project, integrate APIs, handle data, and style the interface. Includes tips on using .env files and suggestions for further development.
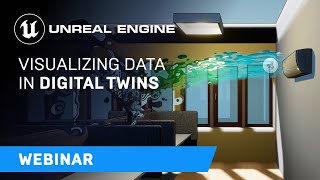
Visualizing Data in Digital Twins with Unreal Engine
Explore digital twin visualization using Unreal Engine, covering IoT sensors, particle systems, and the ADTLink plugin for real-time data analysis and optimization of 3D models.

Running Basic Statistical Analysis in R
Learn to perform essential statistical analyses in R, including correlation, linear modeling, t-tests, and heatmaps. Ideal for beginners seeking to leverage R's powerful command-line interface for data analysis.
How to Use Gganimate in R - A RStudio Tutorial for Beginners
Learn to create dynamic, animated data visualizations in R using gganimate. Master key functions and techniques for enhancing your data storytelling skills.
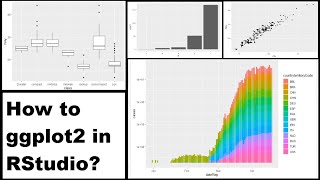
How to Use Ggplot2 in R - A Beginner's RStudio Tutorial
Learn to create data visualizations in R using ggplot2, from basic plots to advanced techniques. Covers installation, data understanding, and various plot types for effective data representation.
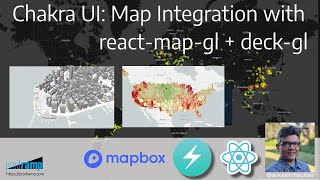
Chakra UI - MAP Integration in React with React-Map-GL and Deck-GL
Learn to integrate interactive maps in React applications using Chakra UI, react-map-gl, and deck.gl. Explore various map layers and visualizations for data-rich, visually appealing map interfaces.
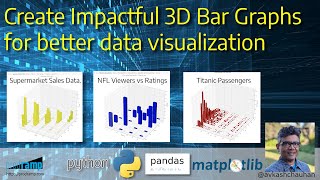
Create Impactful 3D Bar Graphs for Better Data Visualization
Learn to create impactful 3D bar graphs using Python libraries like Pandas and Matplotlib. Explore real-world datasets and master techniques for effective data visualization.